|
|
Meteor Shower
Supporting data supplied by the Global Meteor Network
|

|
|
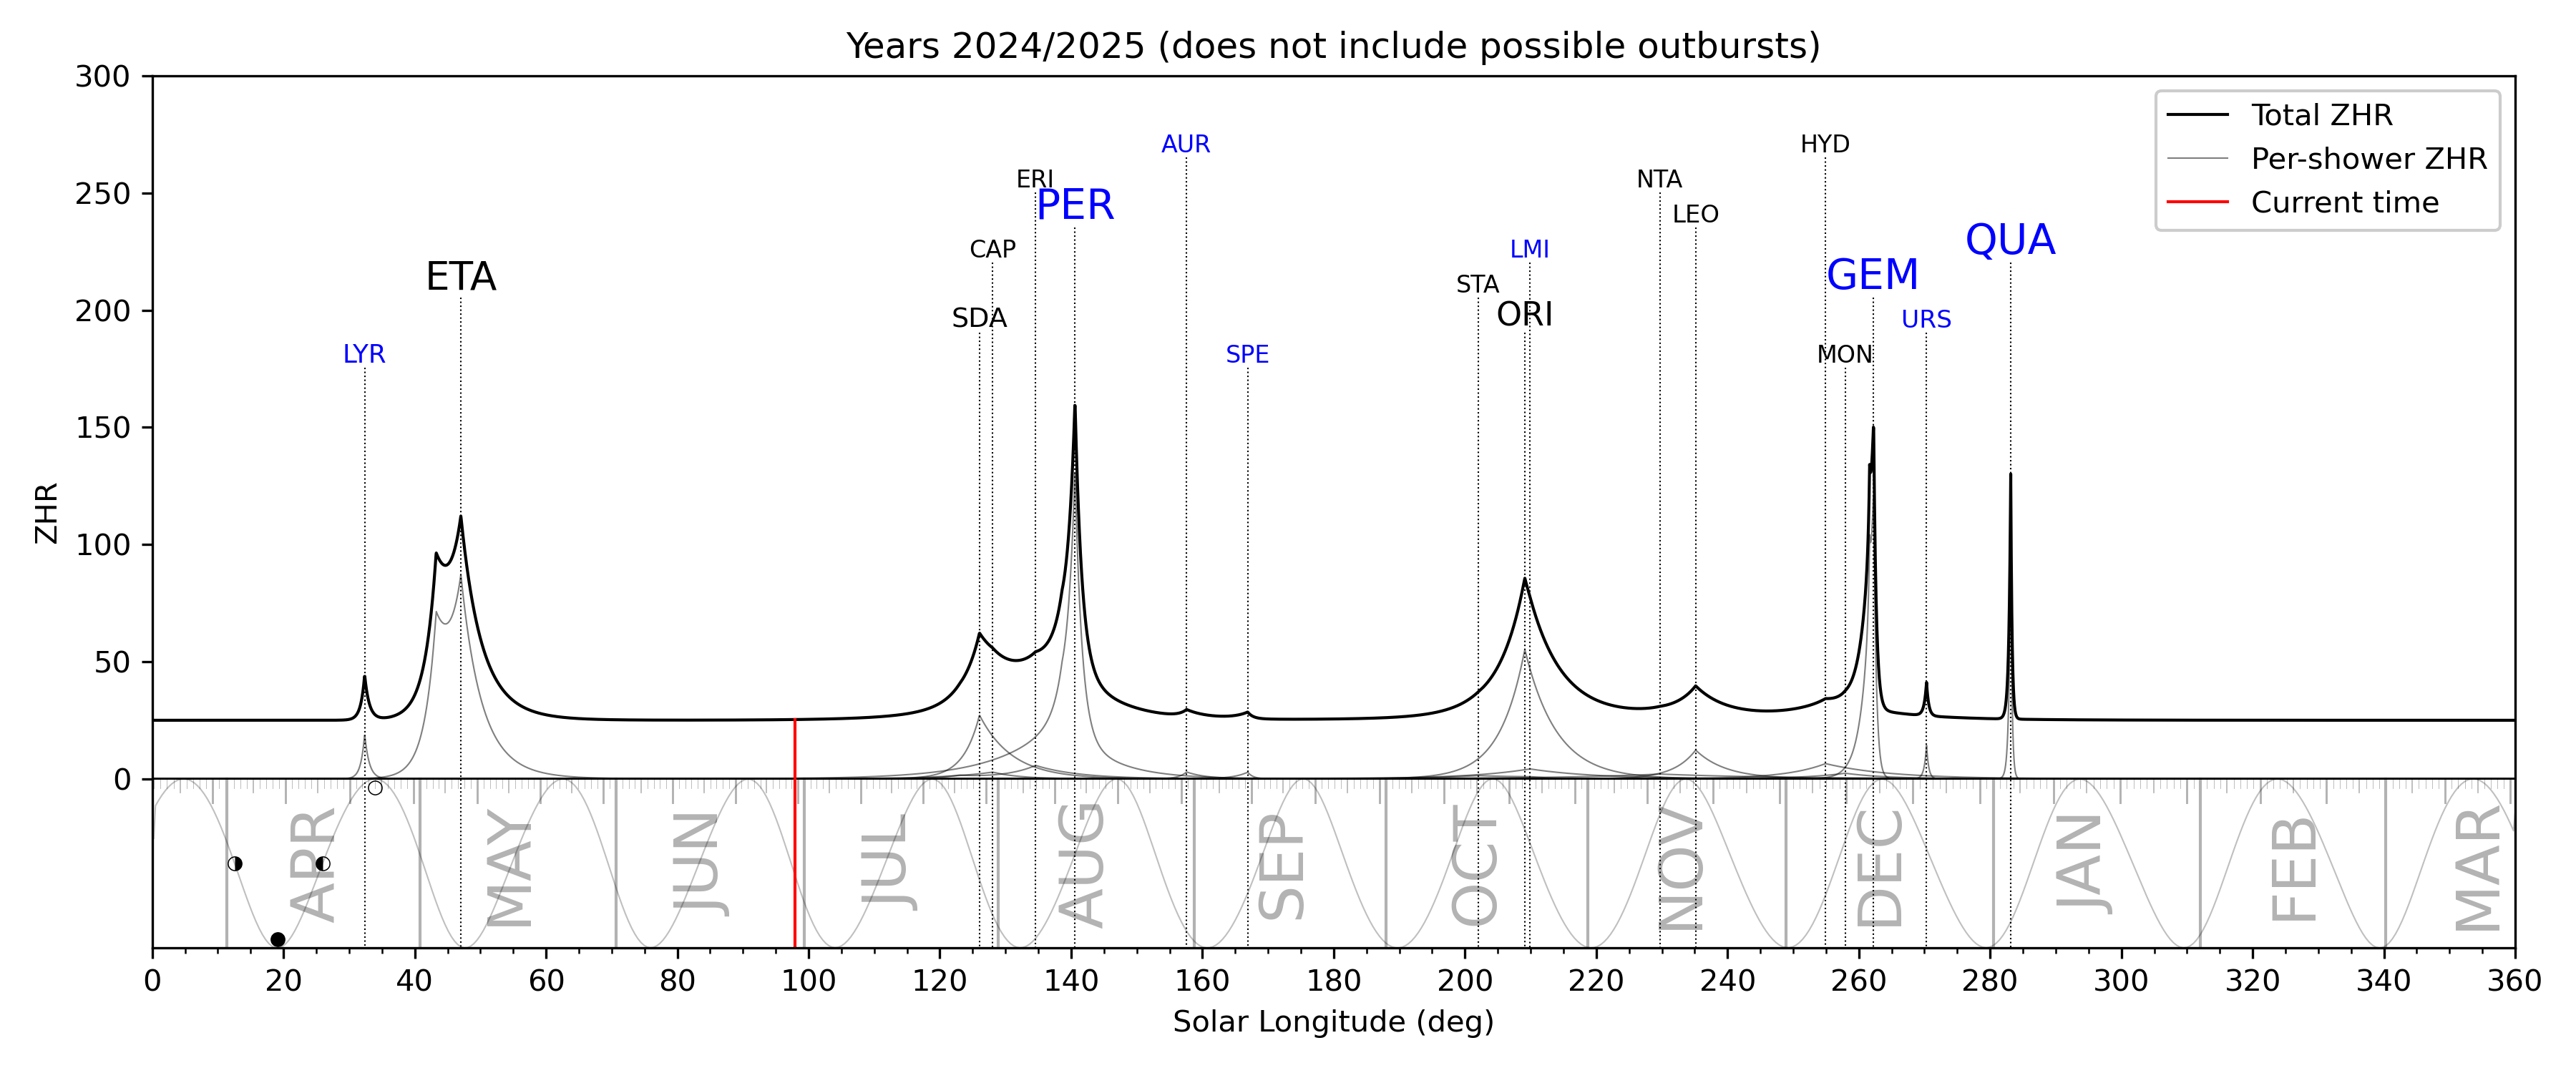
Meteor shower activity level
The dial shows the peak sum of activity from all currently active showers and the sporadic background in the next 24 hours. The numbers are based on previous observations and predictions of future activity. The real activity might be lower or higher than the predicted value, as meteor showers can have unexpected outbursts. See the plots below for the latest real-time meteor shower activity measurements.
How many meteors will I see?
ZHR stands for Zenithal Hourly Rate and is the number of meteors a single observer would see in one hour in ideal conditions: under a clear, moonless dark sky with the radiant directly overhead.
The ZHR is not the number of meteors an observer will see in reality - for example, during the peak of the Perseids when their ZHR is about 100, you can expect to see about one Perseid every minute. However, if the Moon is full this number is easily halved, and if the radiant is low in the sky (below 30 degrees) you will see even less.
When should I observe?
An average observer will notice significantly increased meteor activity when the ZHR is above ~50 (the needle is in the green), which corresponds to the peak activity of the top 10 most active showers.
Outside rare meteor shower outbursts, the three showers which put on a regular annual show that is
worth watching (ZHR > 100) are the Perseids (Aug 11 - 13), Geminids (Dec 13 - 14) and Quadrantids (Jan 3 - 4).
The plot below which summarizes the usual activity of annual meteor showers but excludes outbursts.
Northern hemisphere showers (declination > 30 deg) are shown in blue, while southern hemisphere showers
(declination < -30 deg) are shown in red (none currently). The showers in between are shown in black and are usually visible
from both hemispheres.
Currently active showers
Last update:
2026-07-28 12:41:34 UTC
Solar longitude 125.1018 deg
(indicated by a red vertical line on the flux plots)
Previous plots can be found here: Archival data
Information about the data is provided in a section below: About
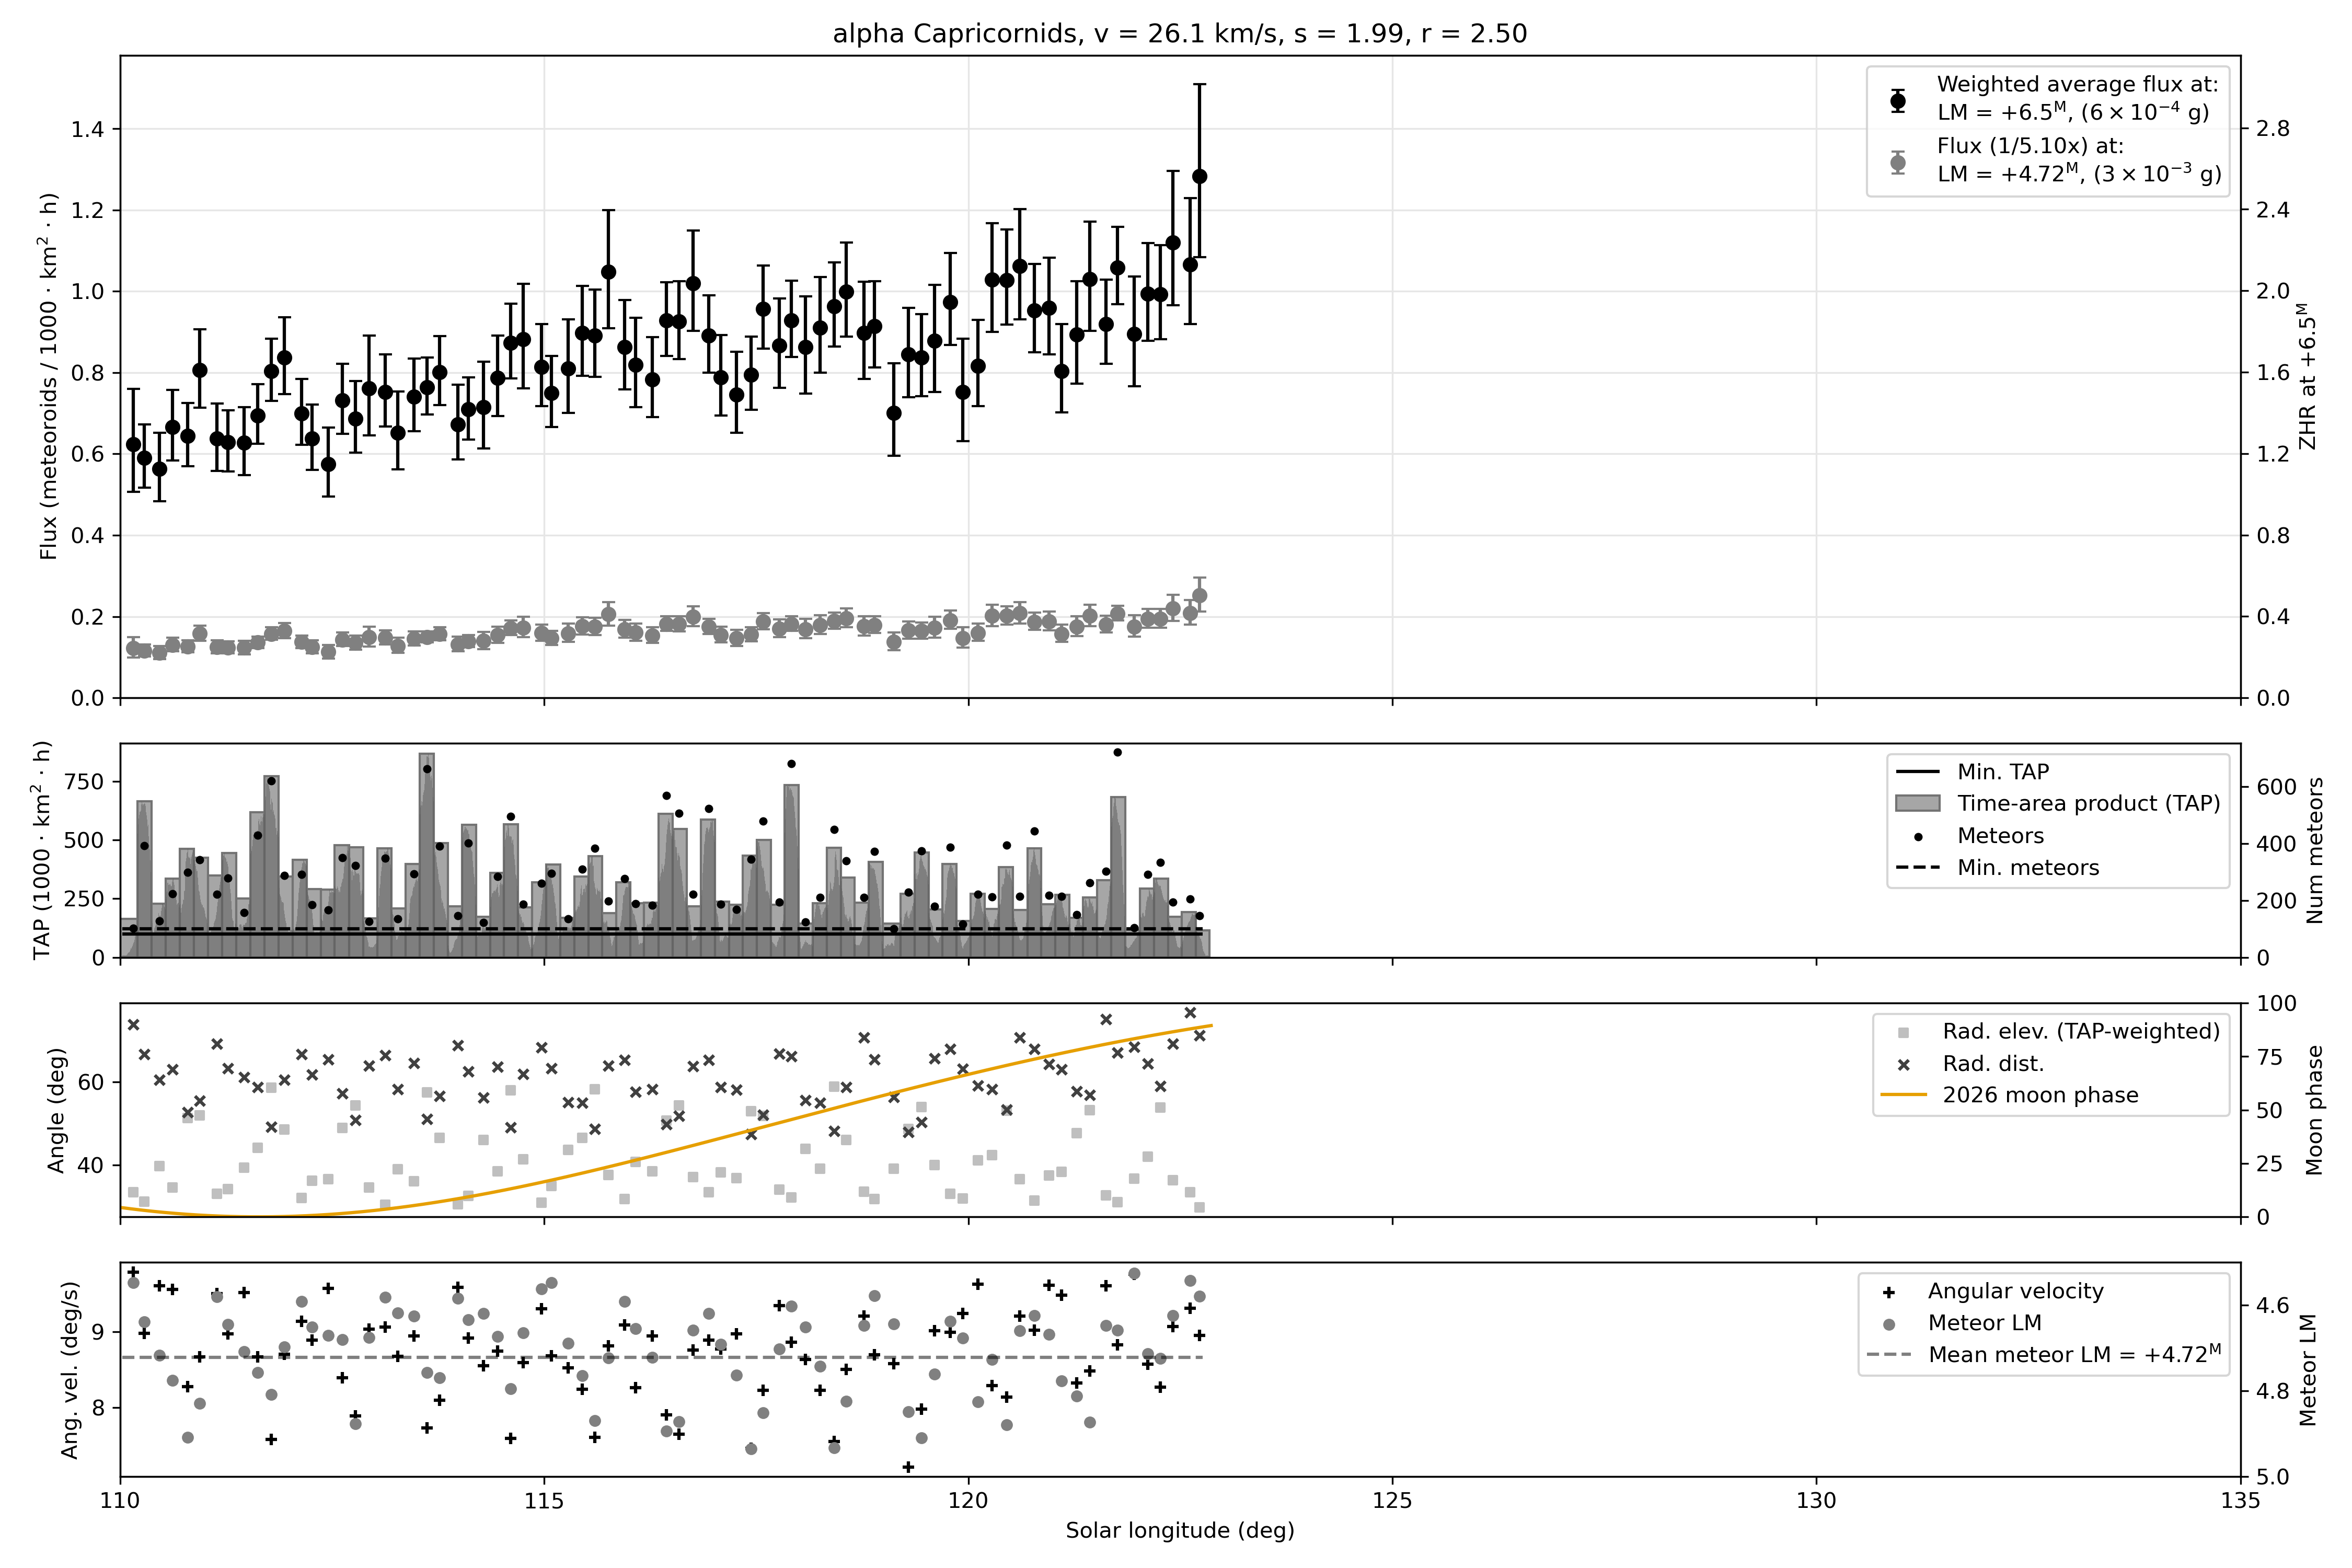
#1 CAP - alpha Capricornids
Year 2026
Years 2024 - 2026

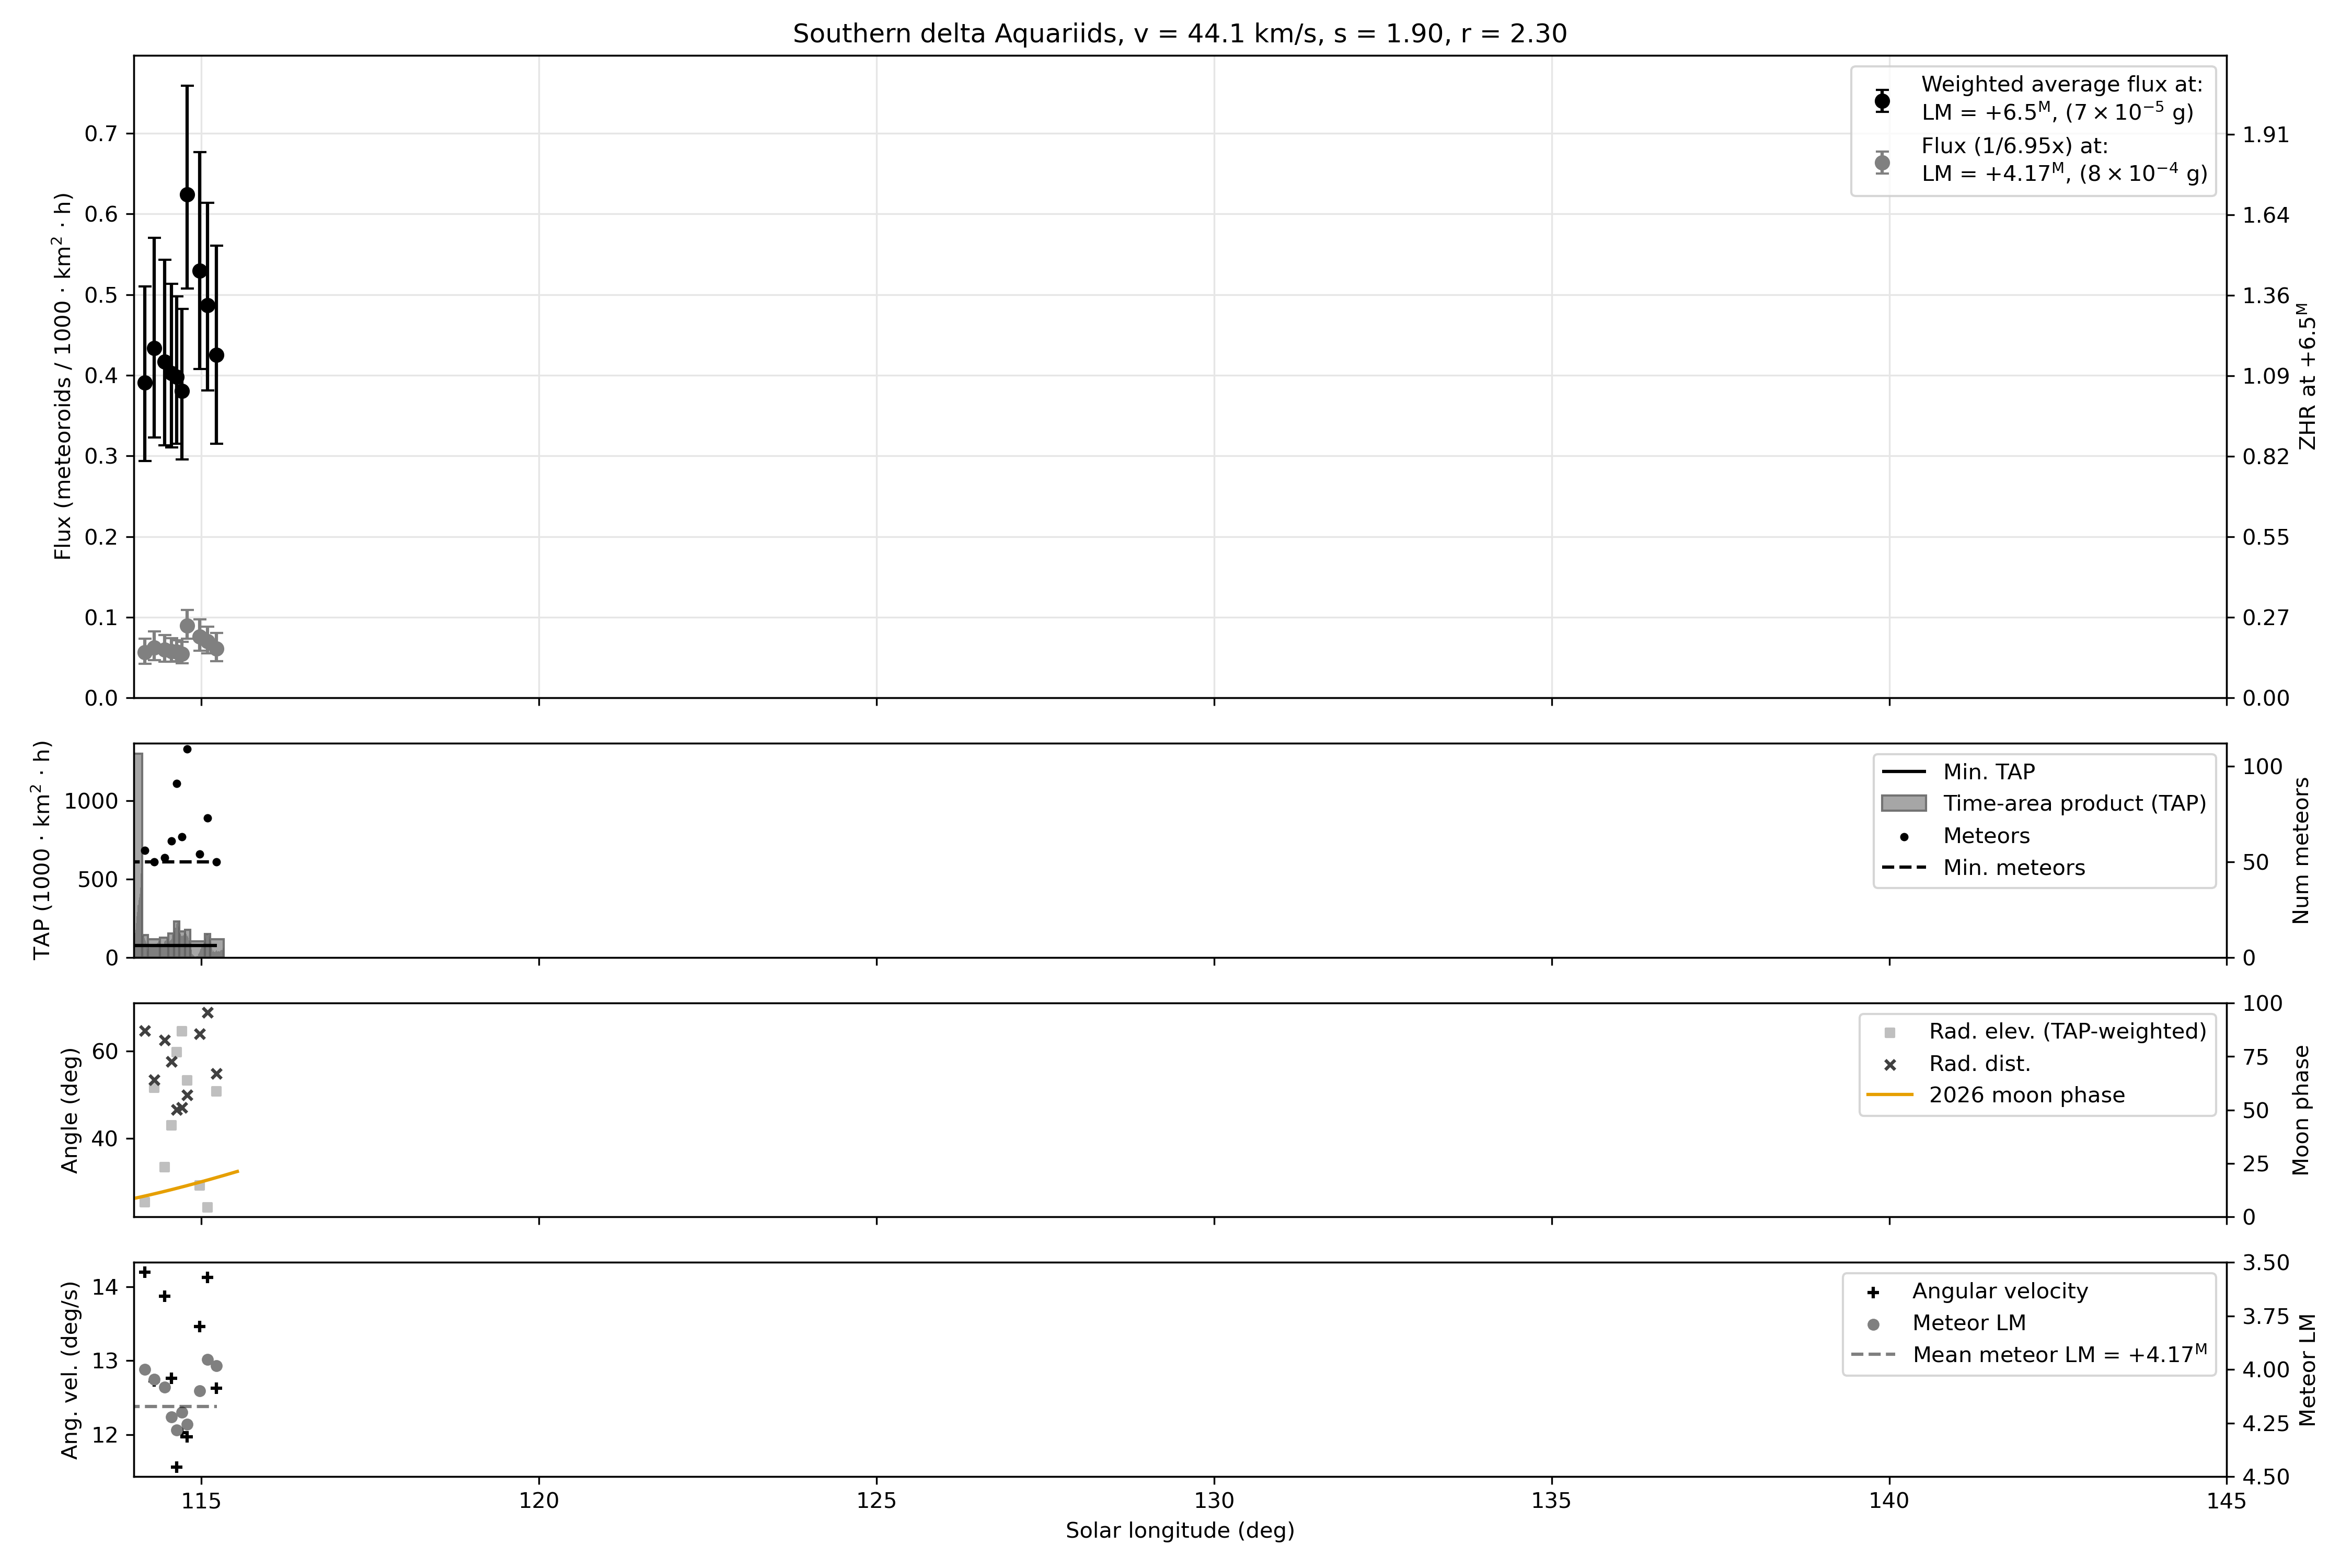
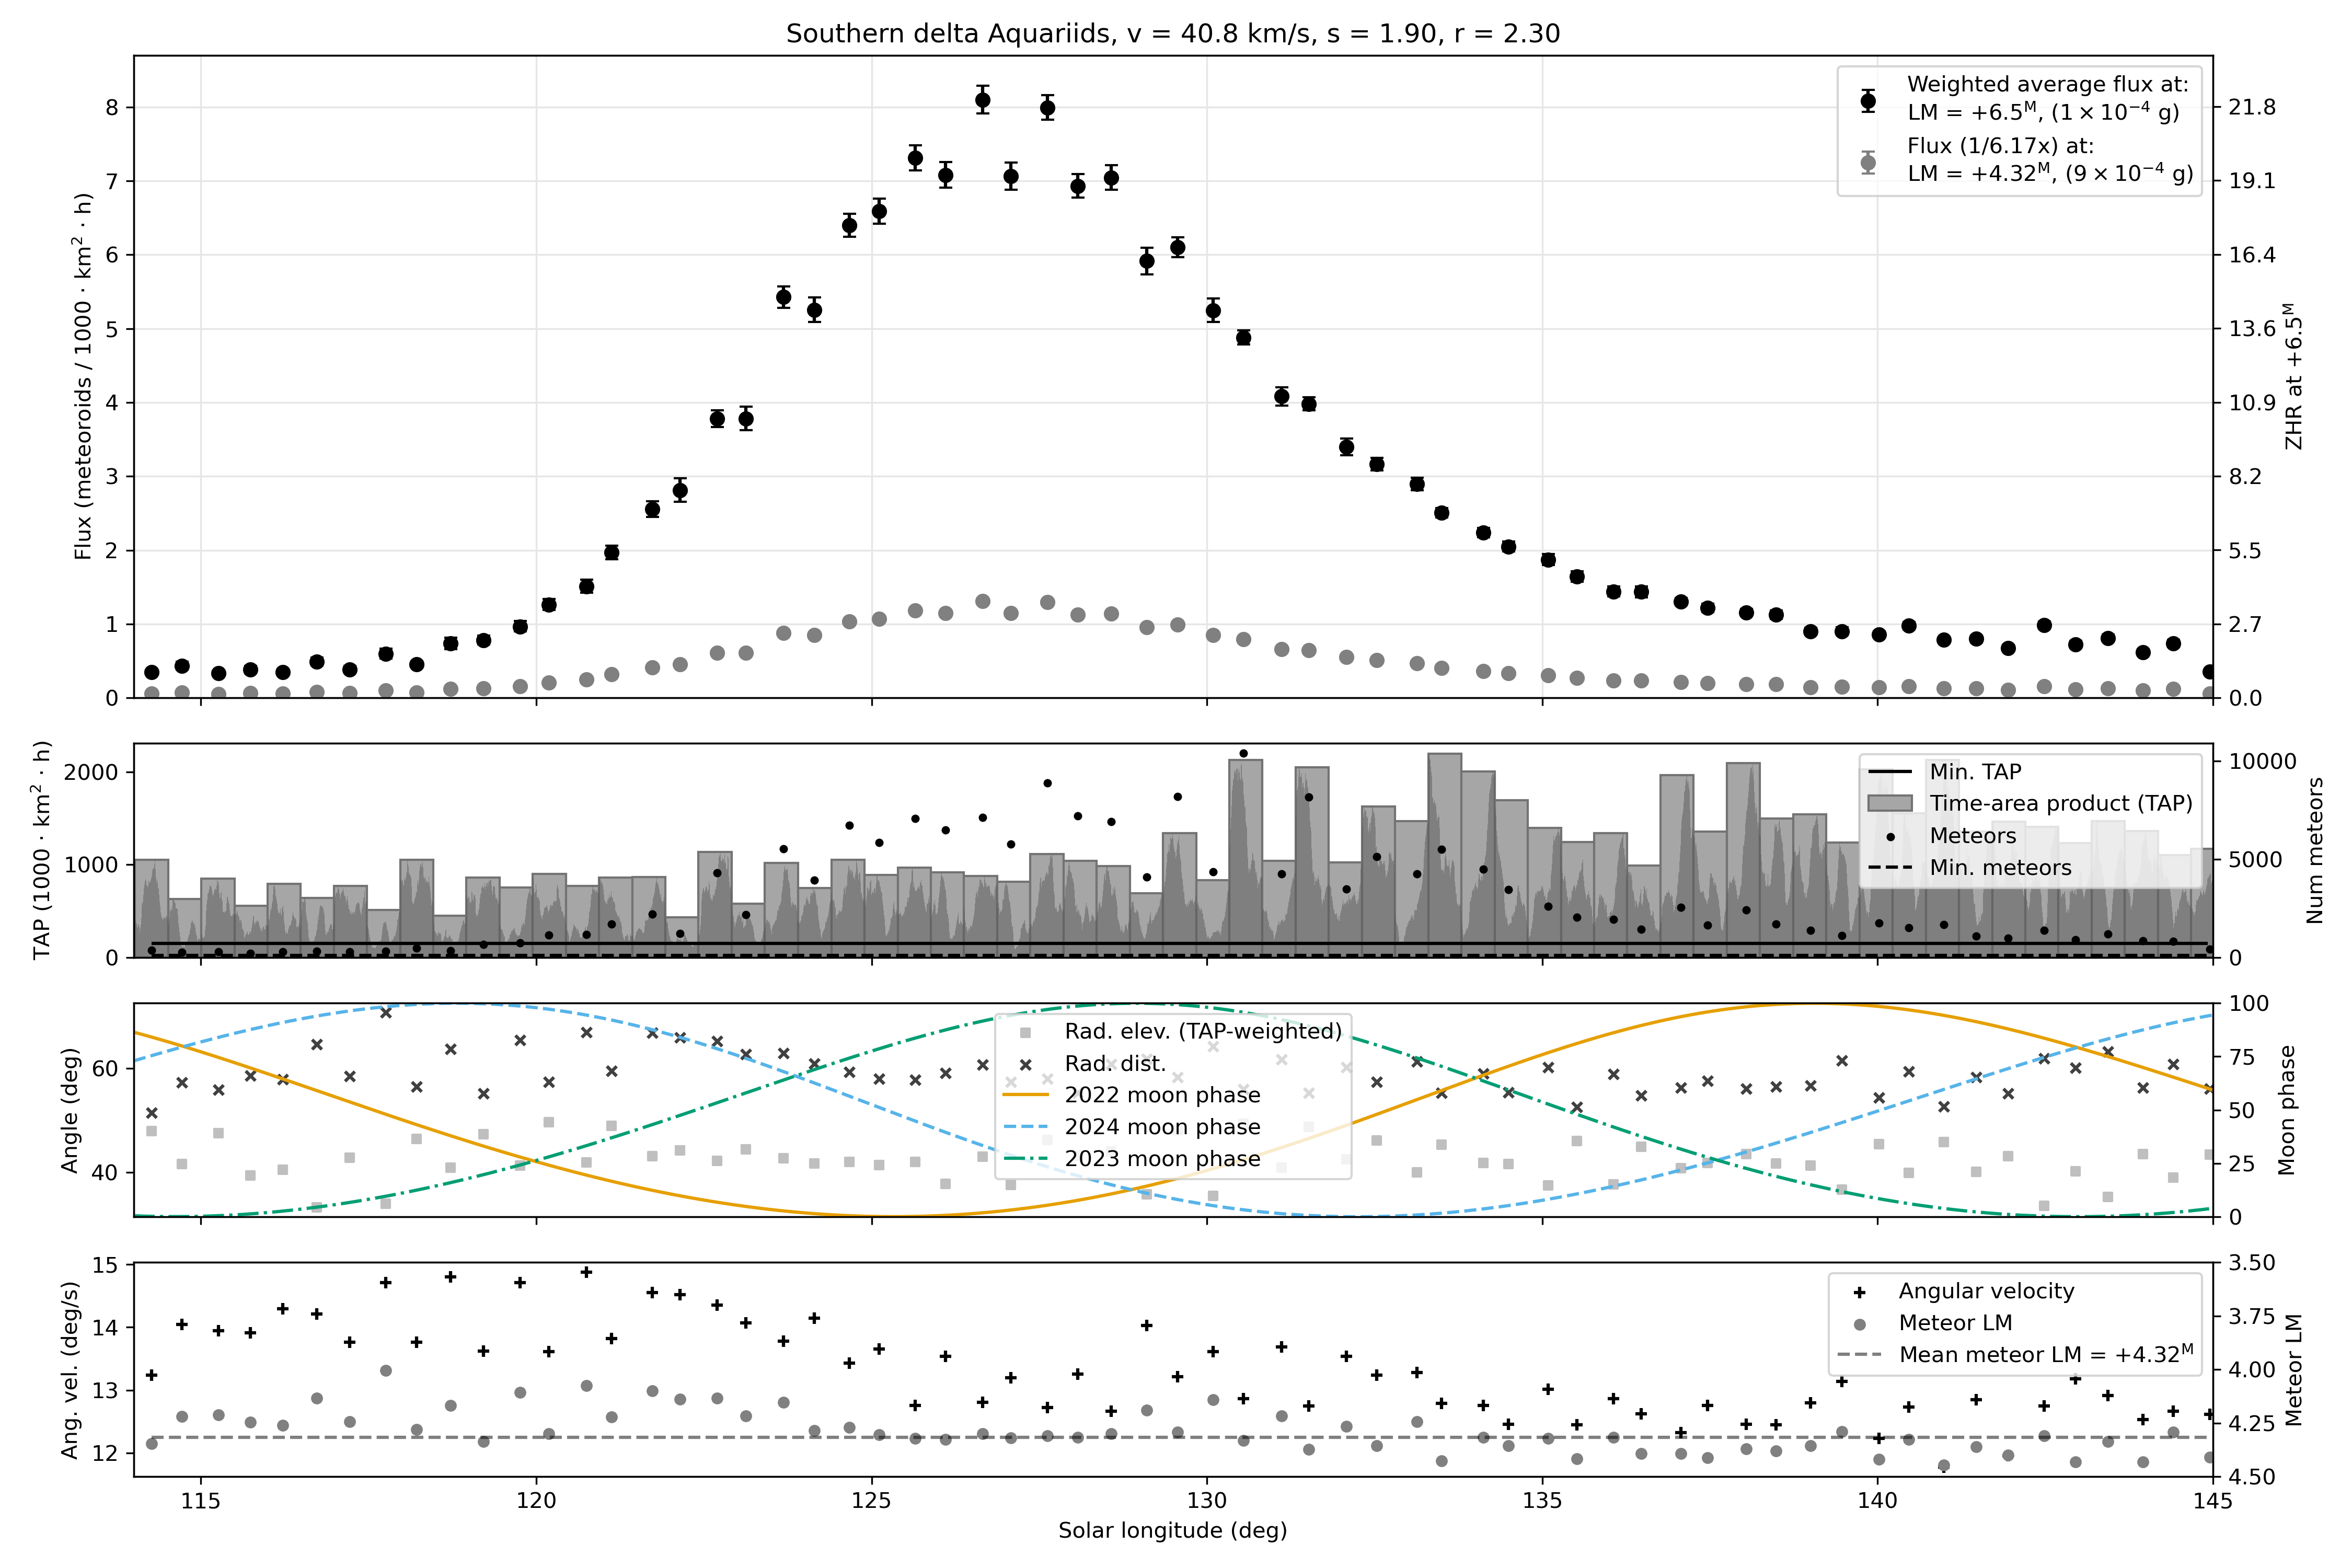
#5 SDA - Southern delta Aquariids
Year 2026
Years 2024 - 2026
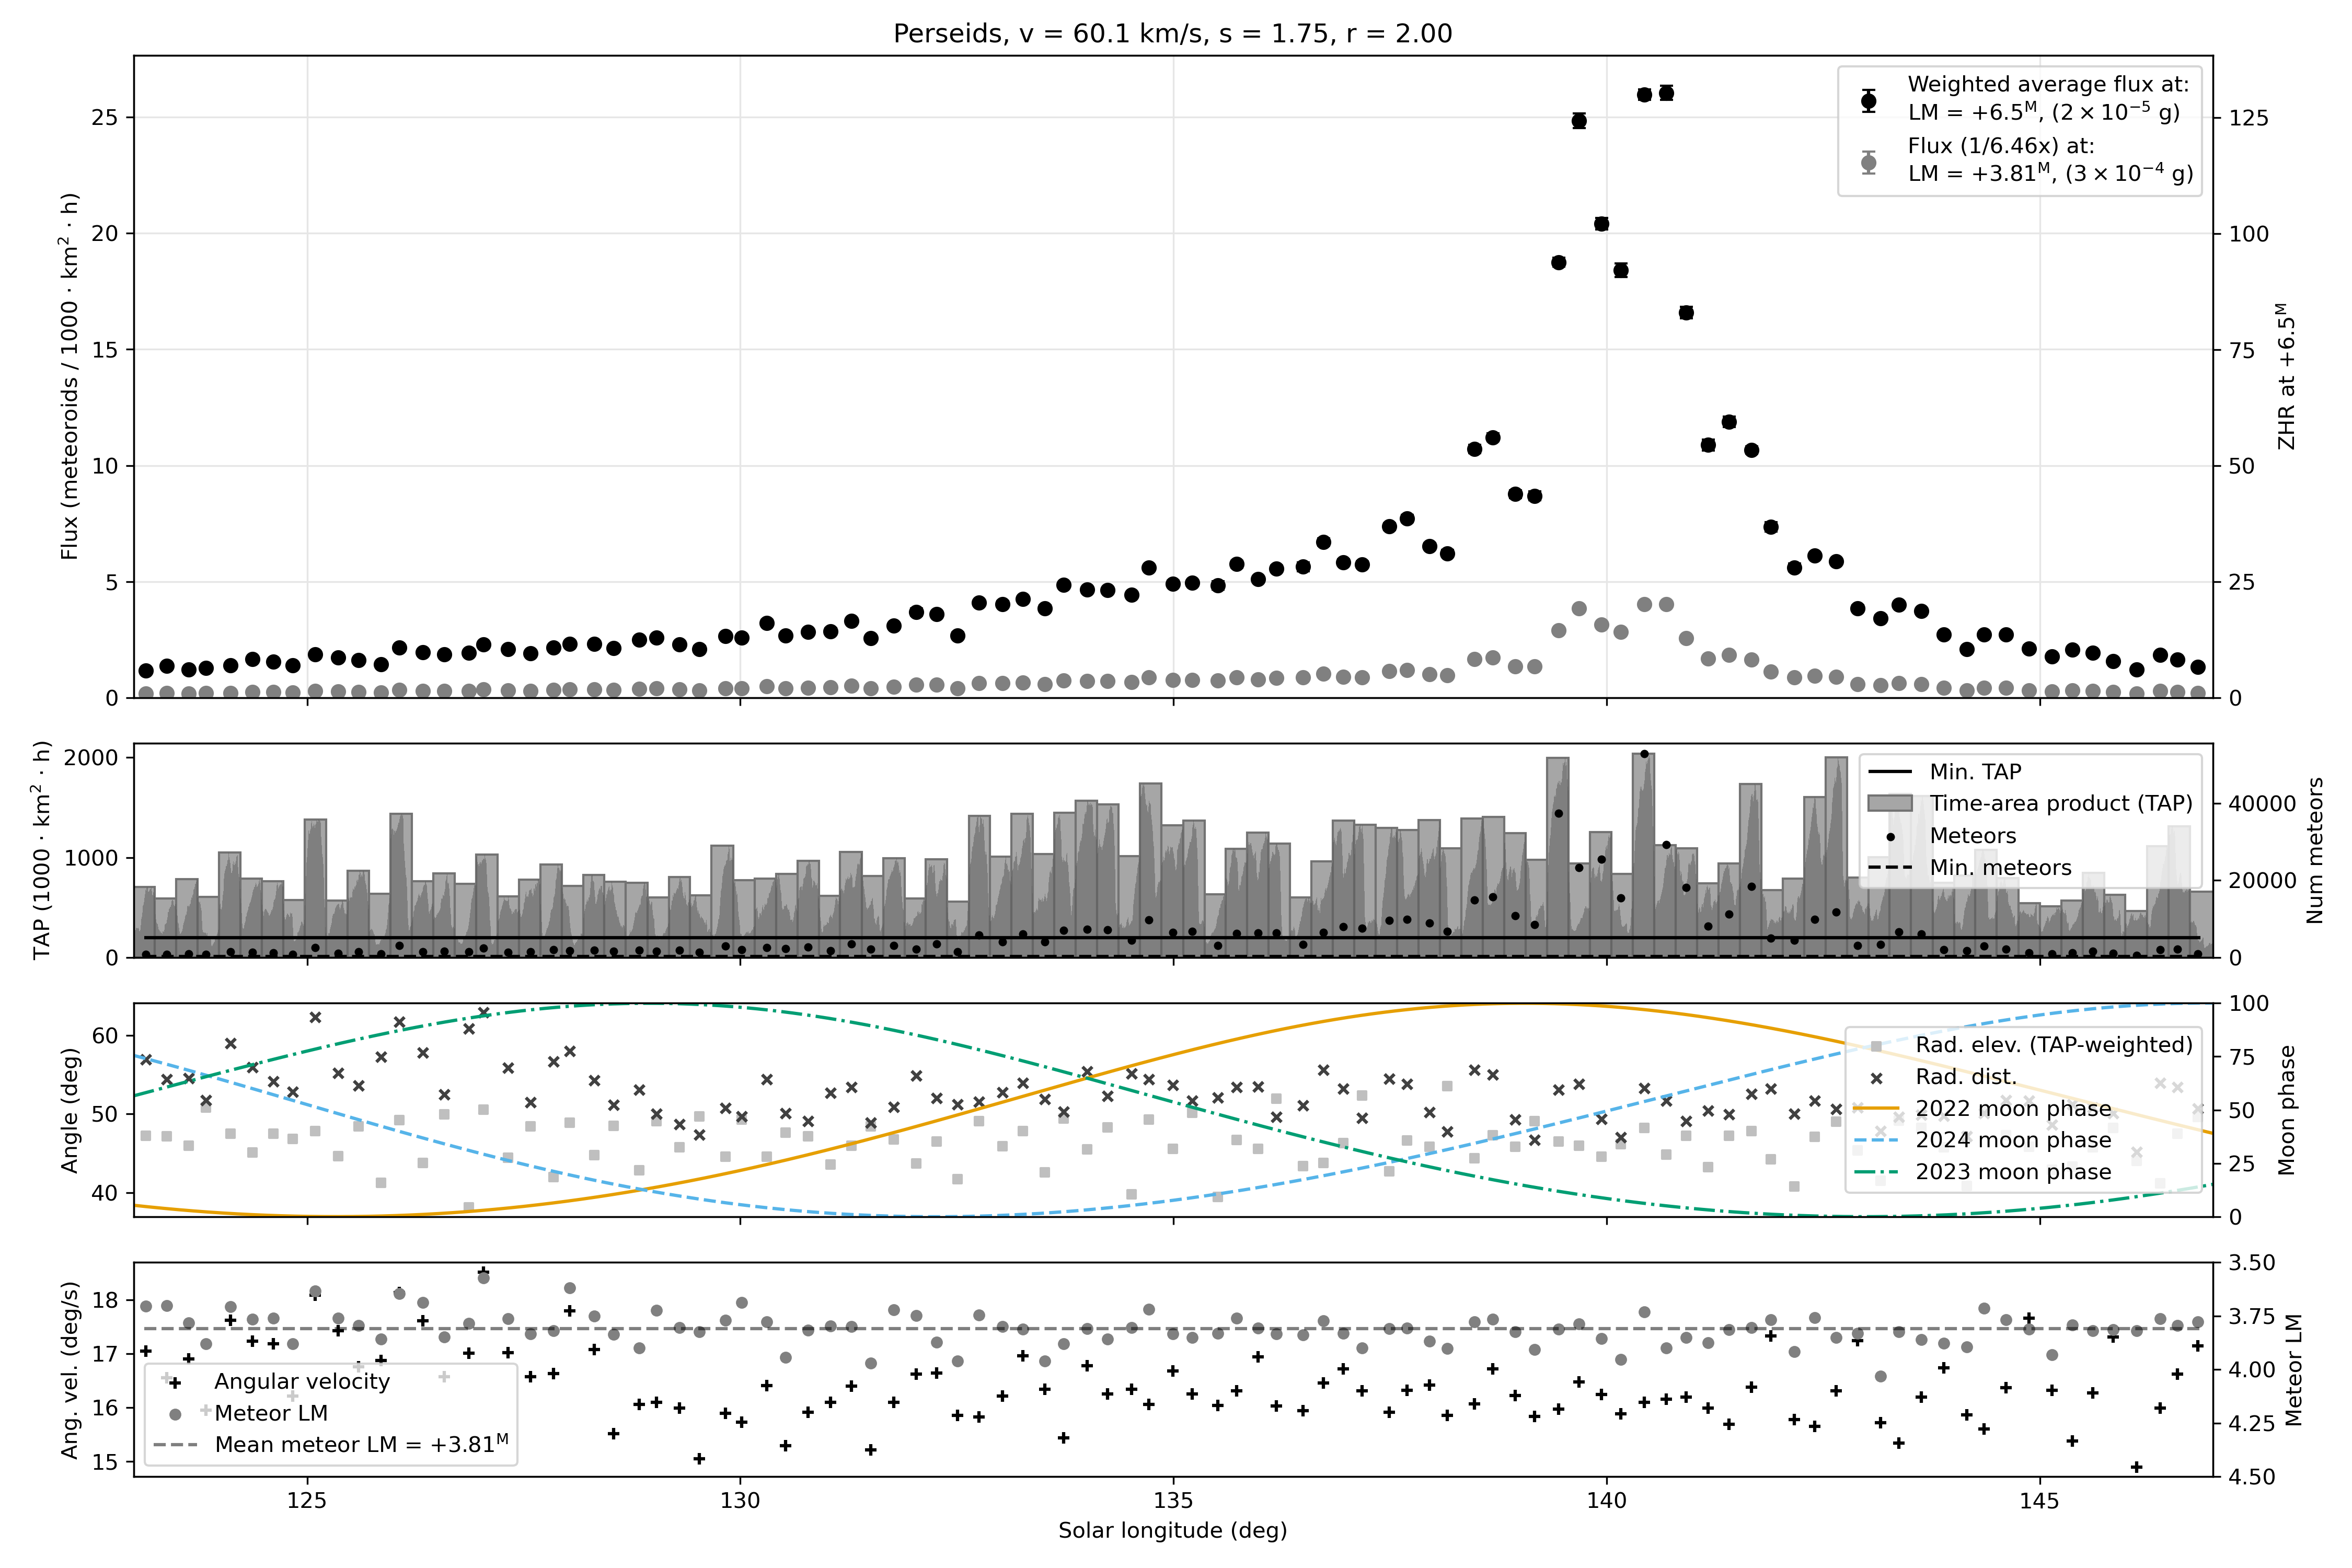
#7 PER - Perseids
Year 2026

Years 2024 - 2026
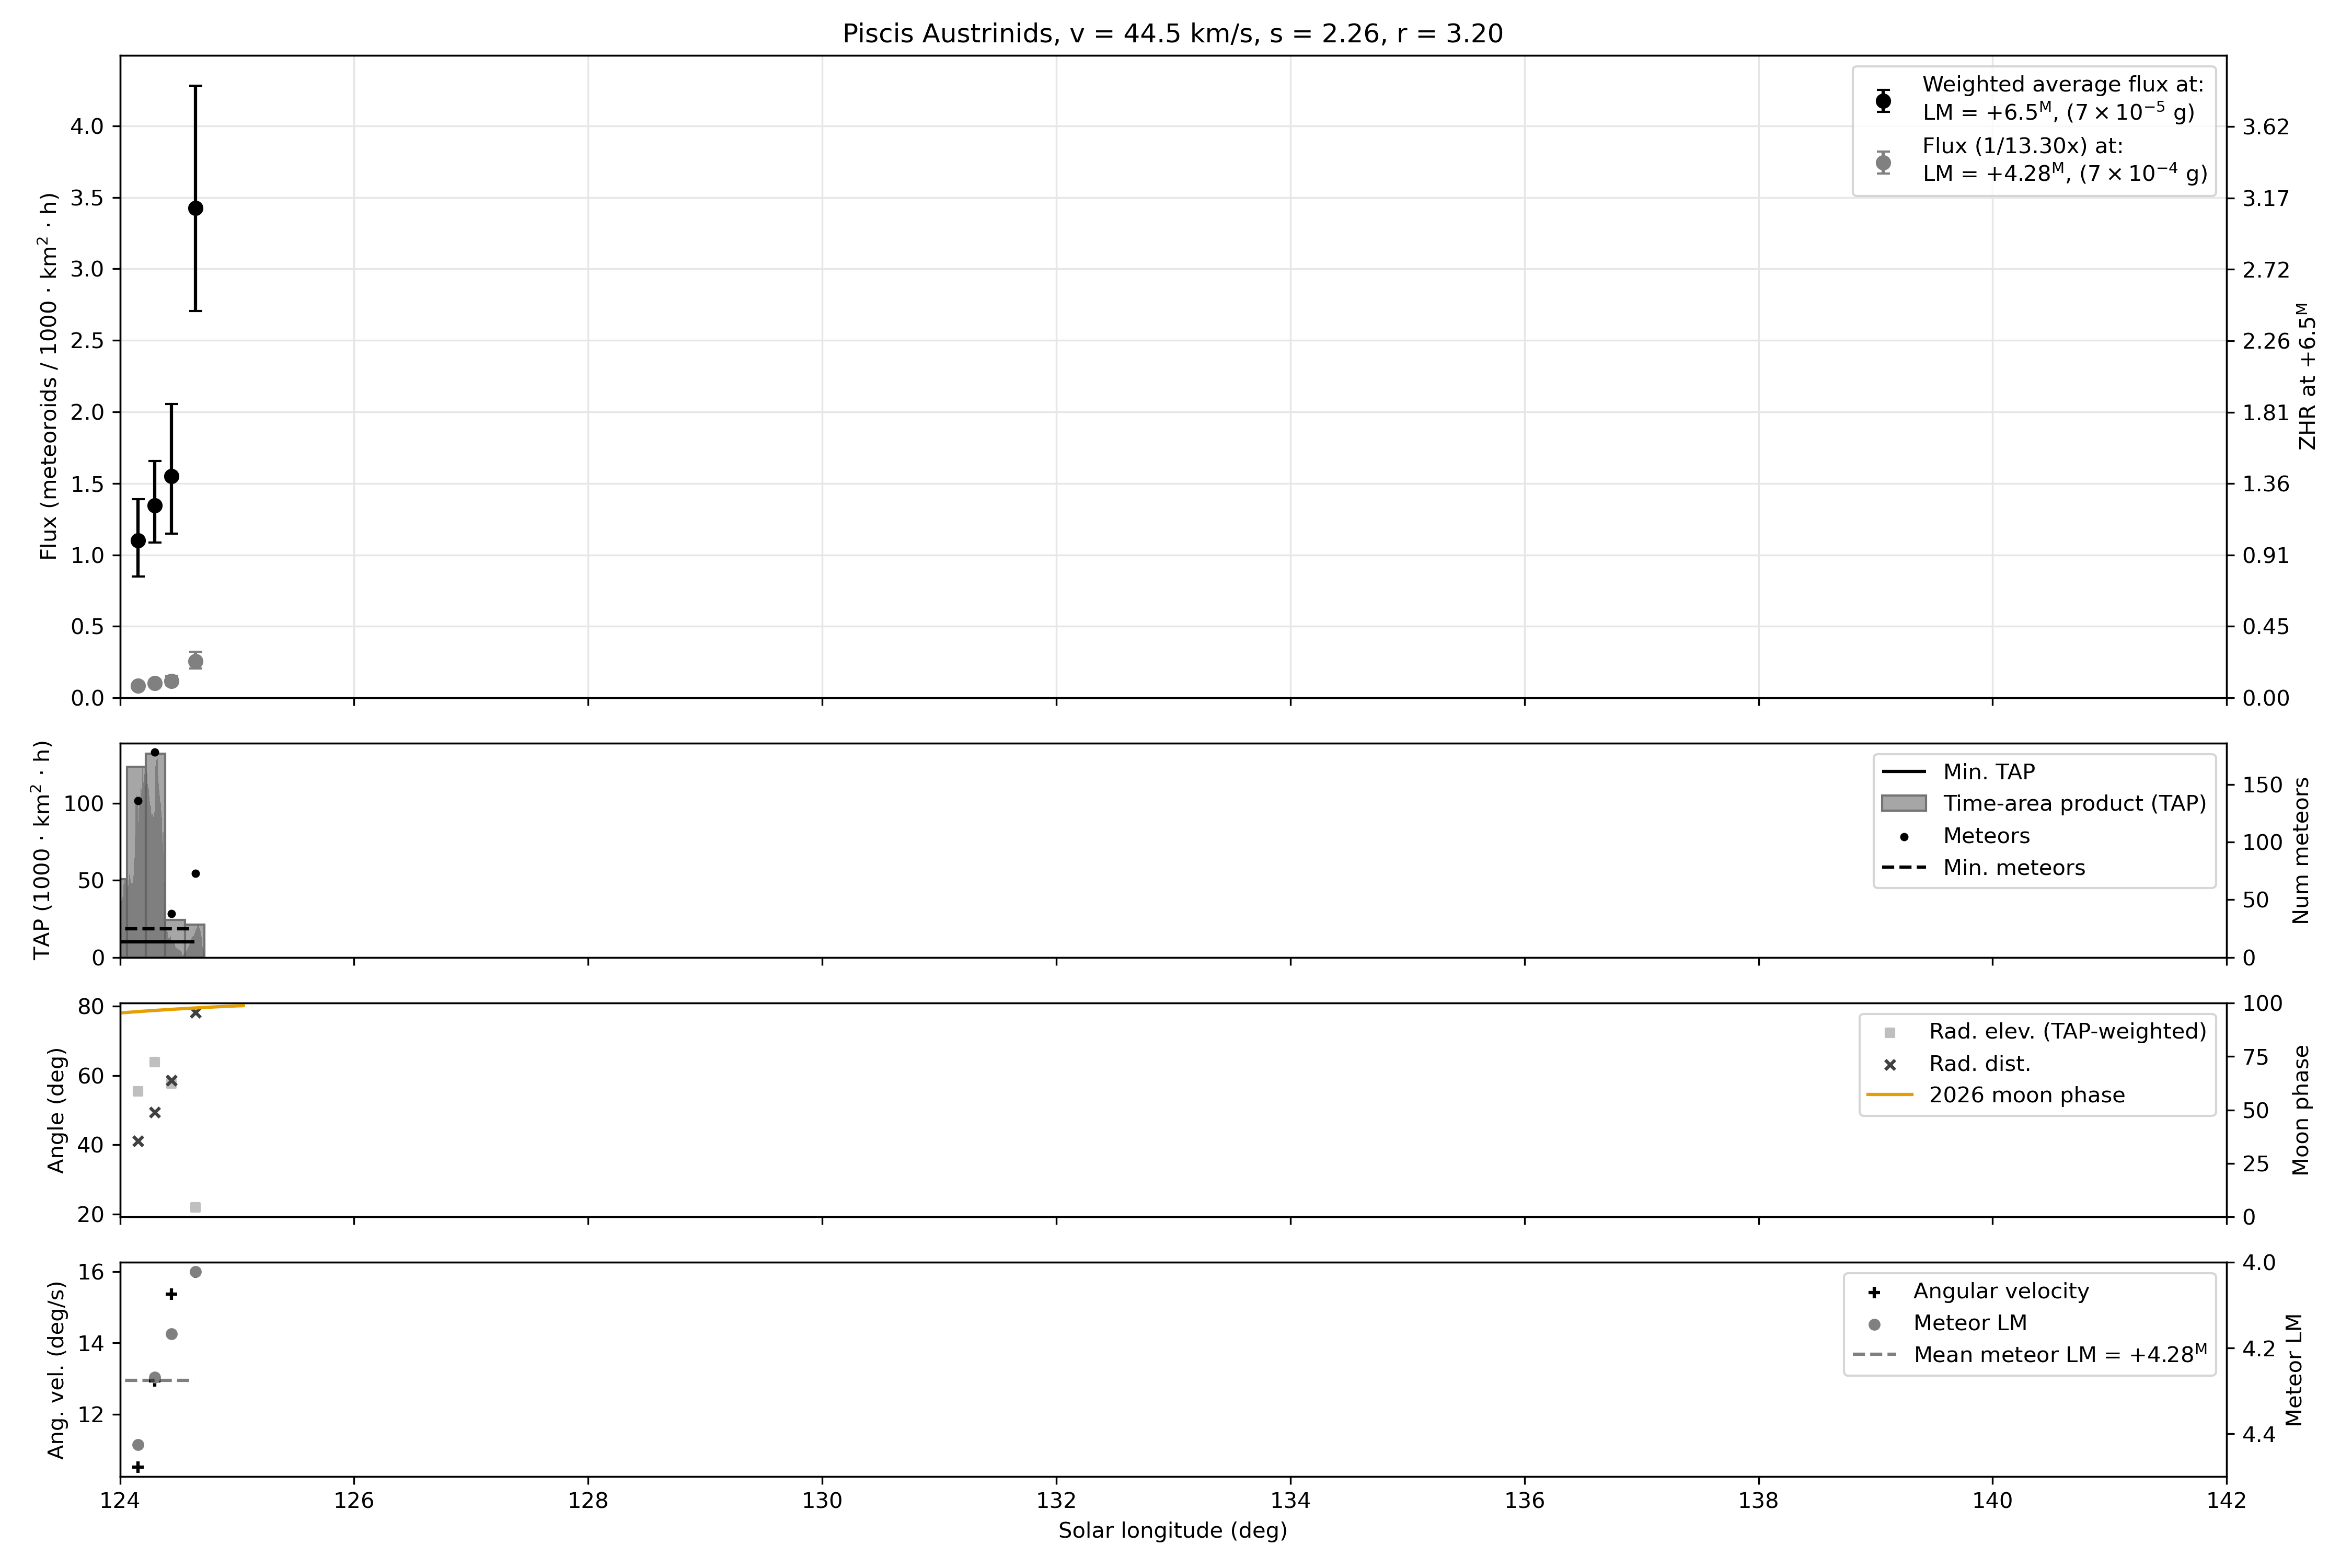
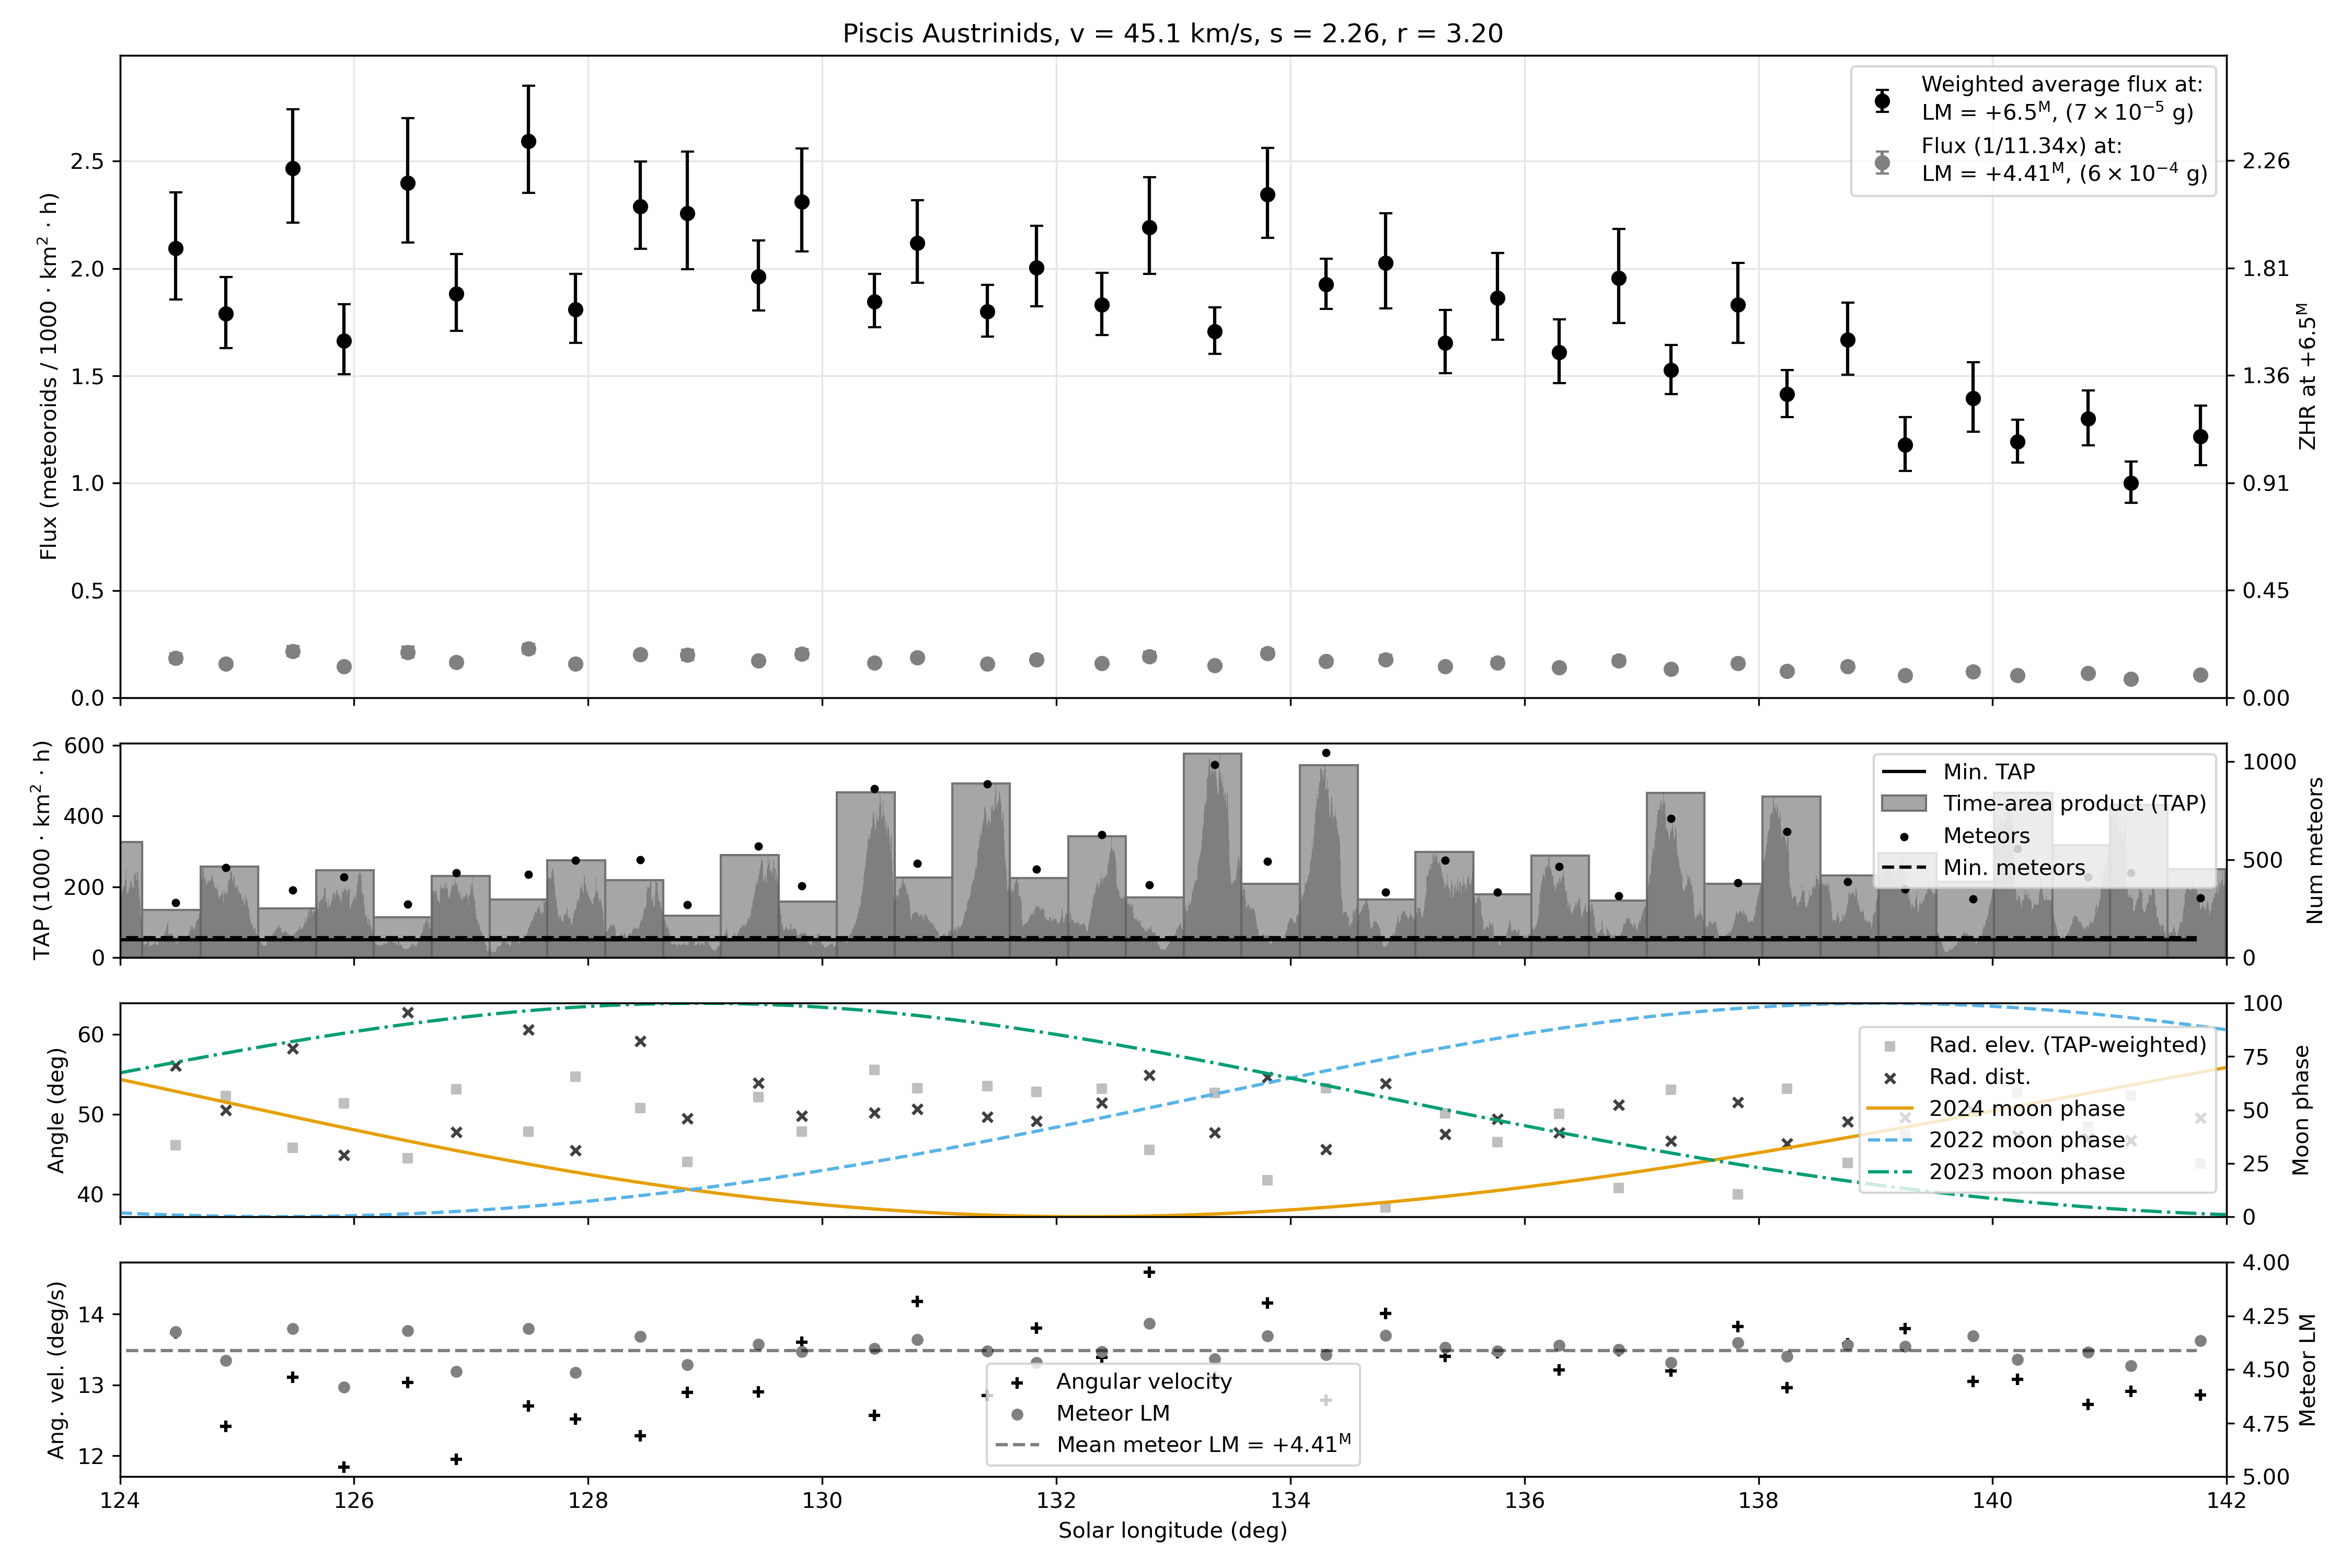
#183 PAU - Piscis Austrinids
Year 2026
Years 2024 - 2026
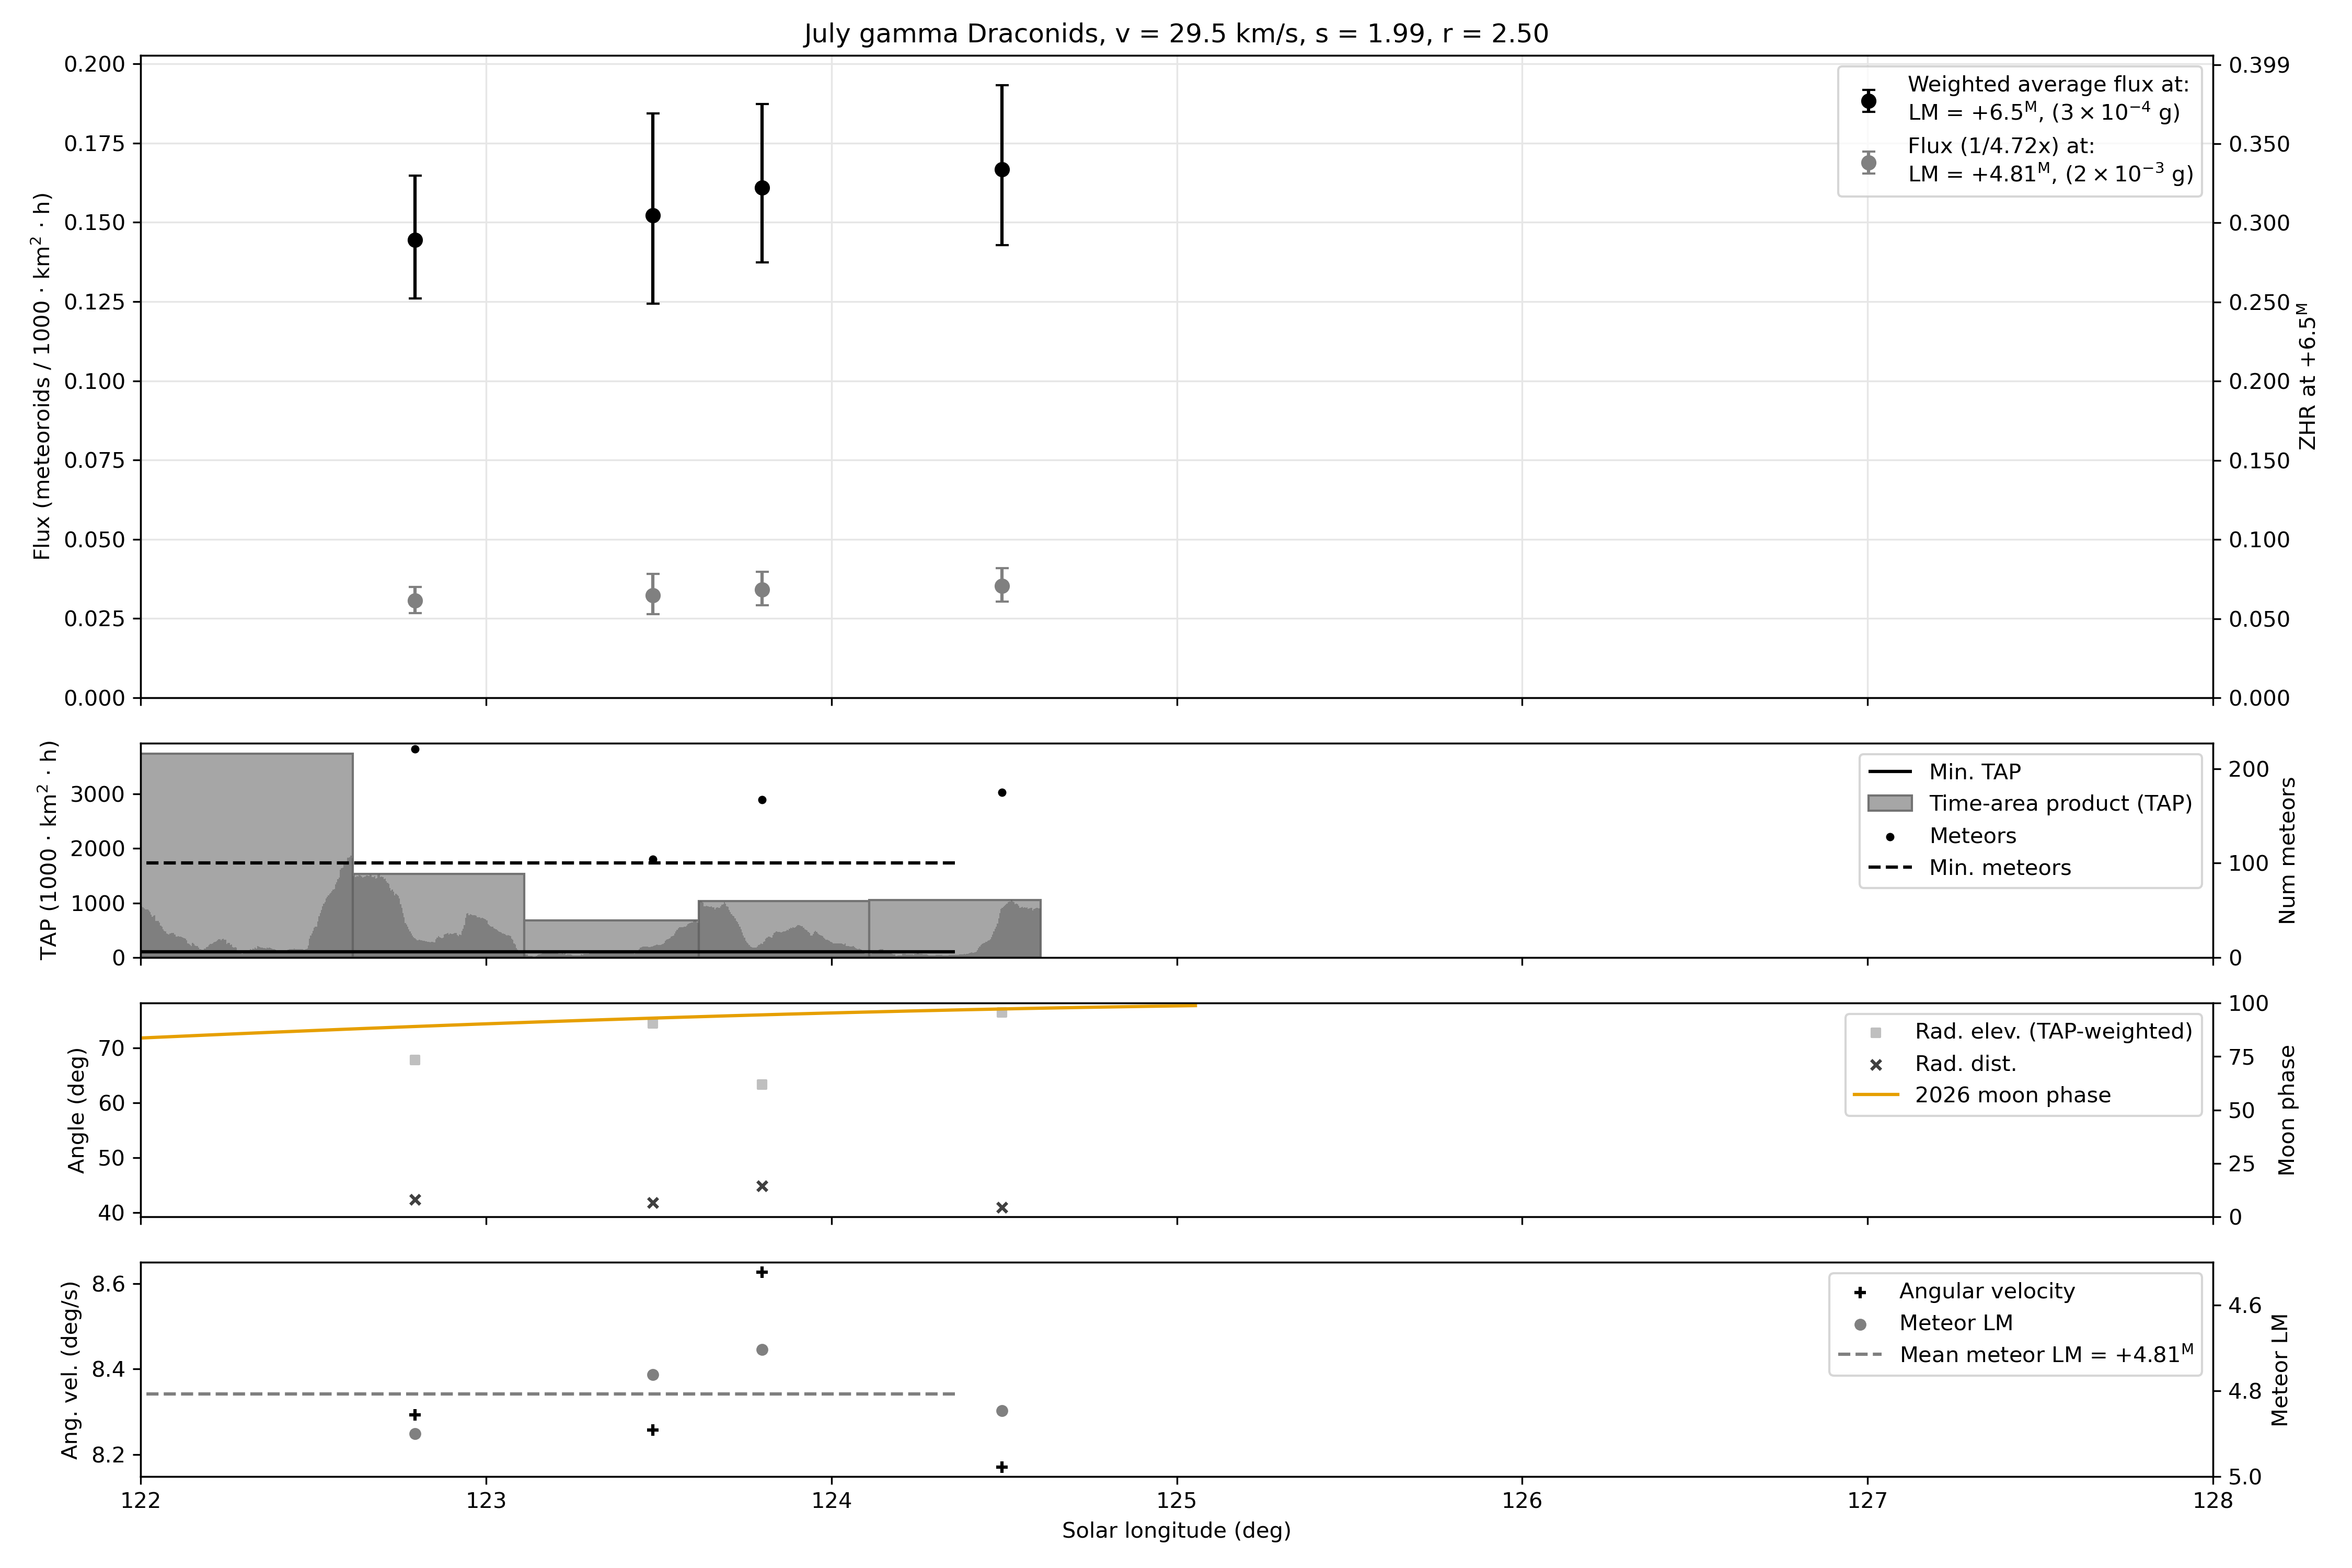
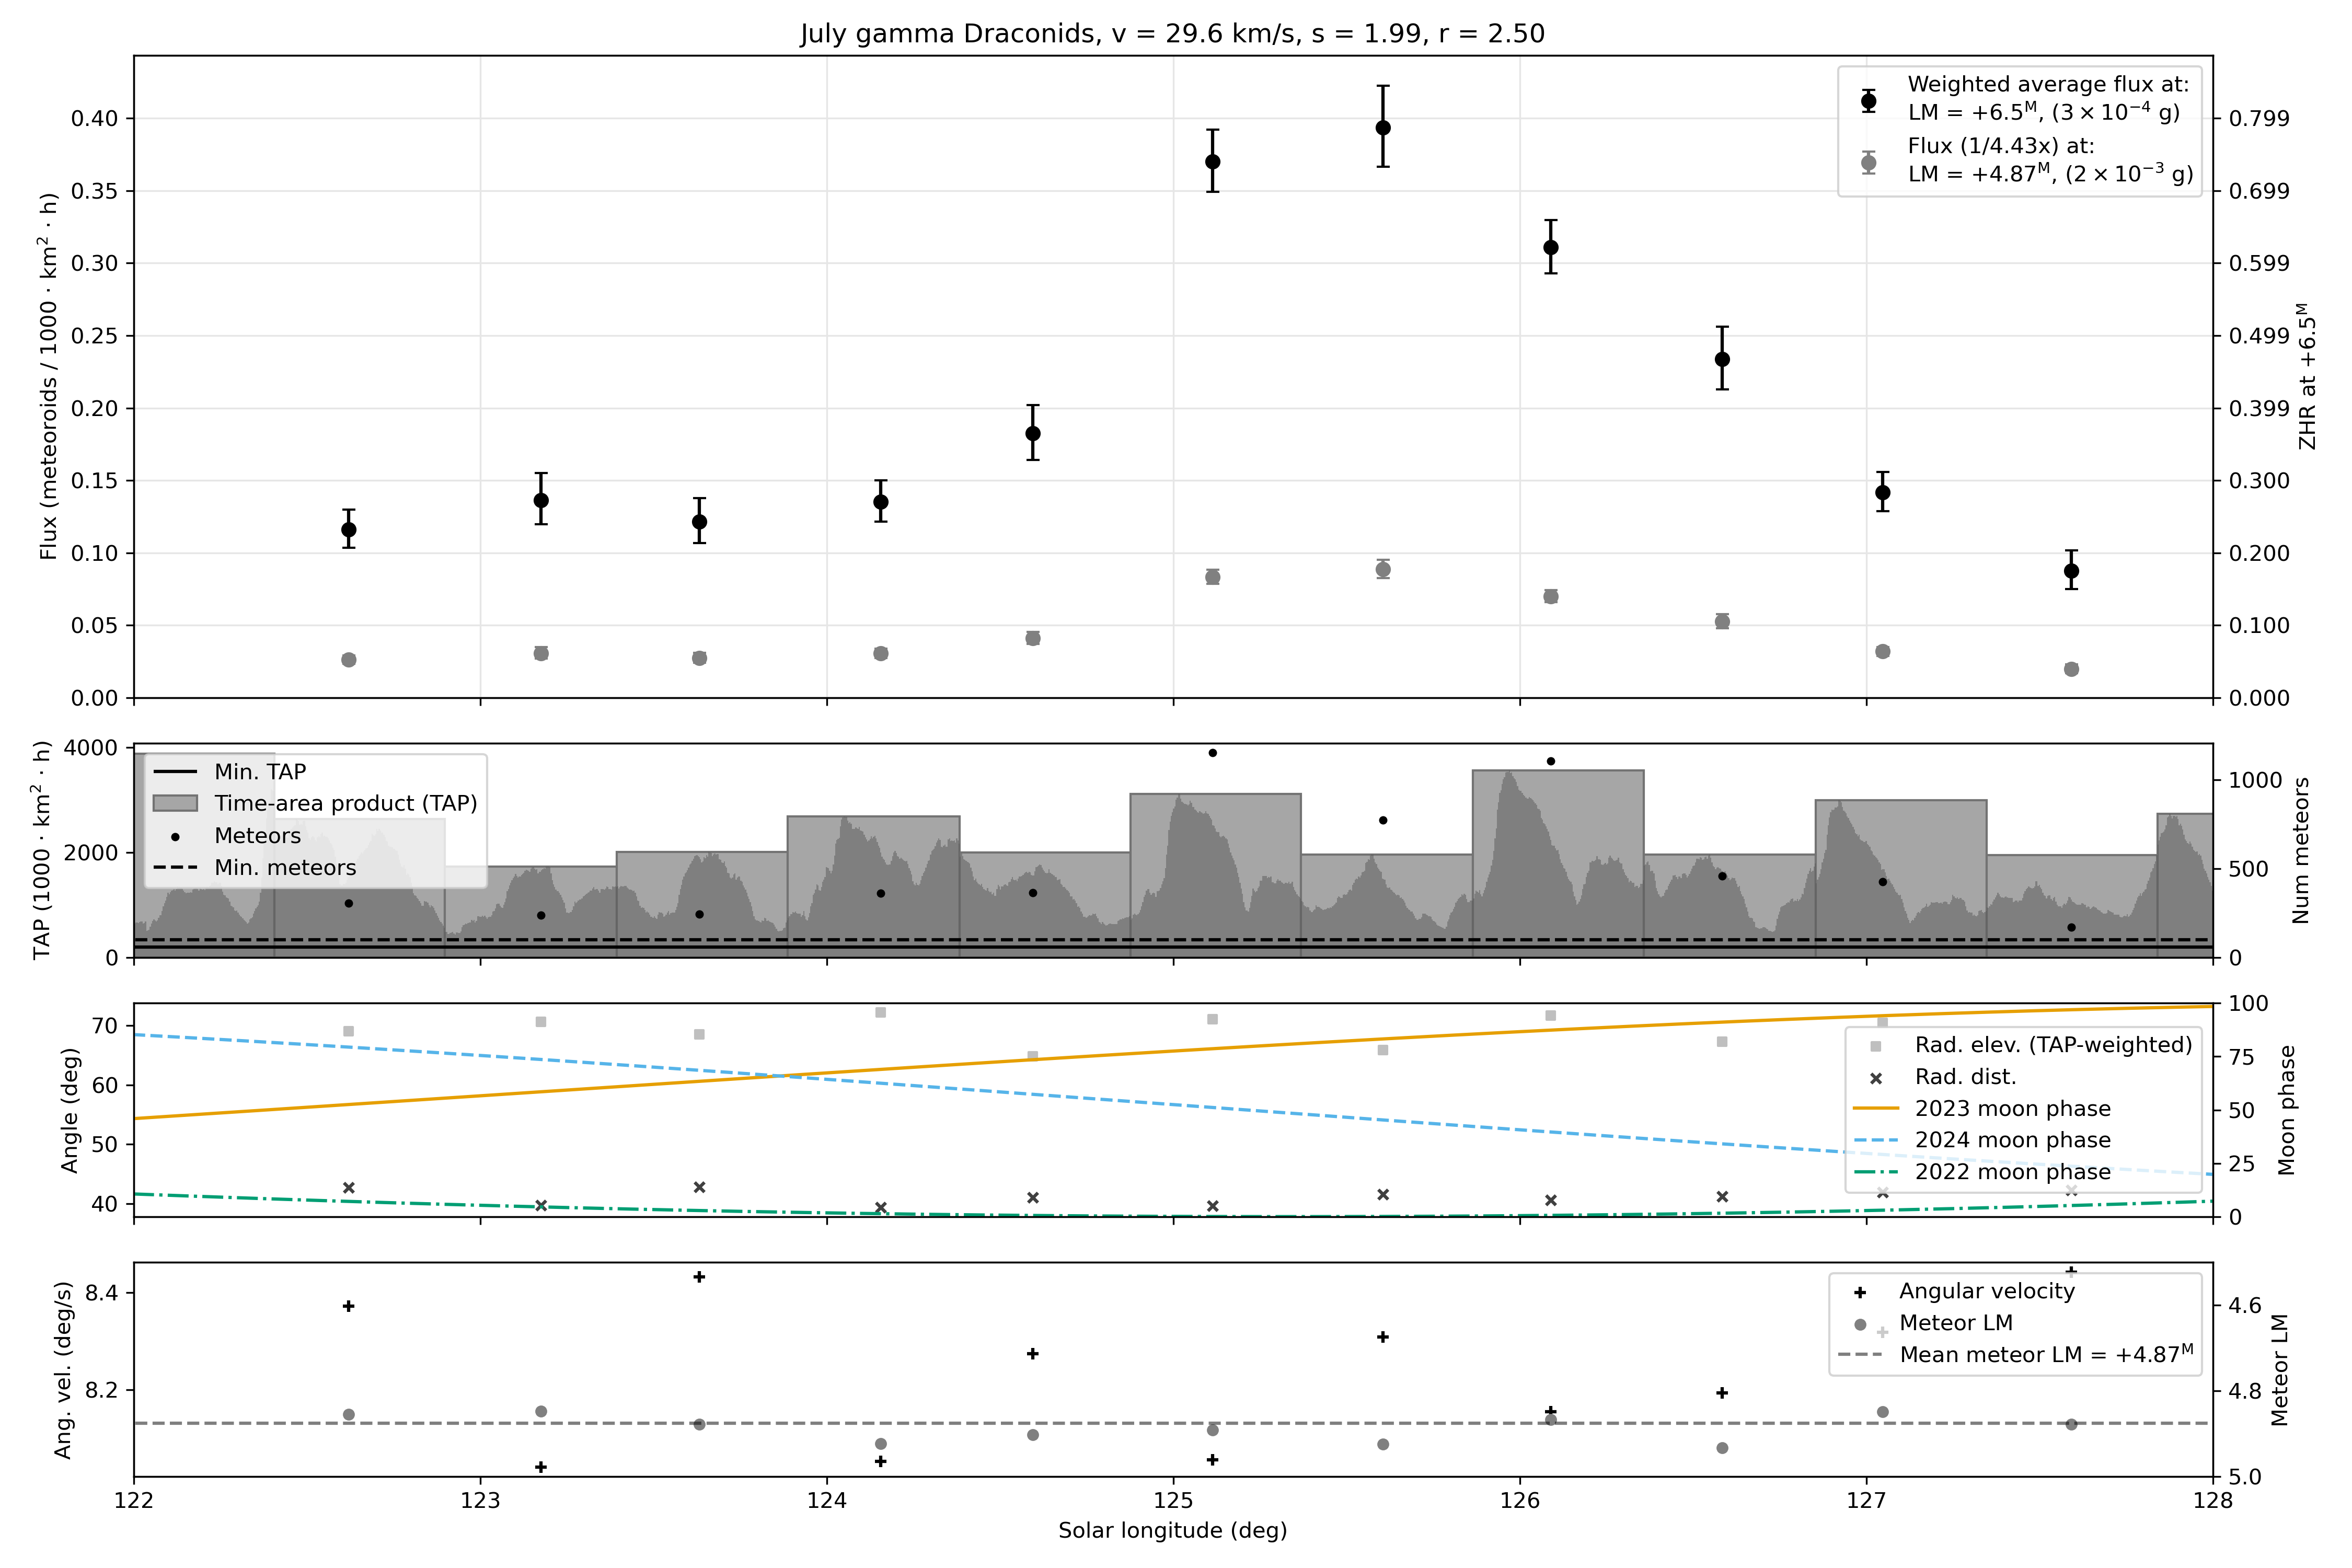
#184 GDR - July gamma Draconids
Year 2026
Years 2024 - 2026
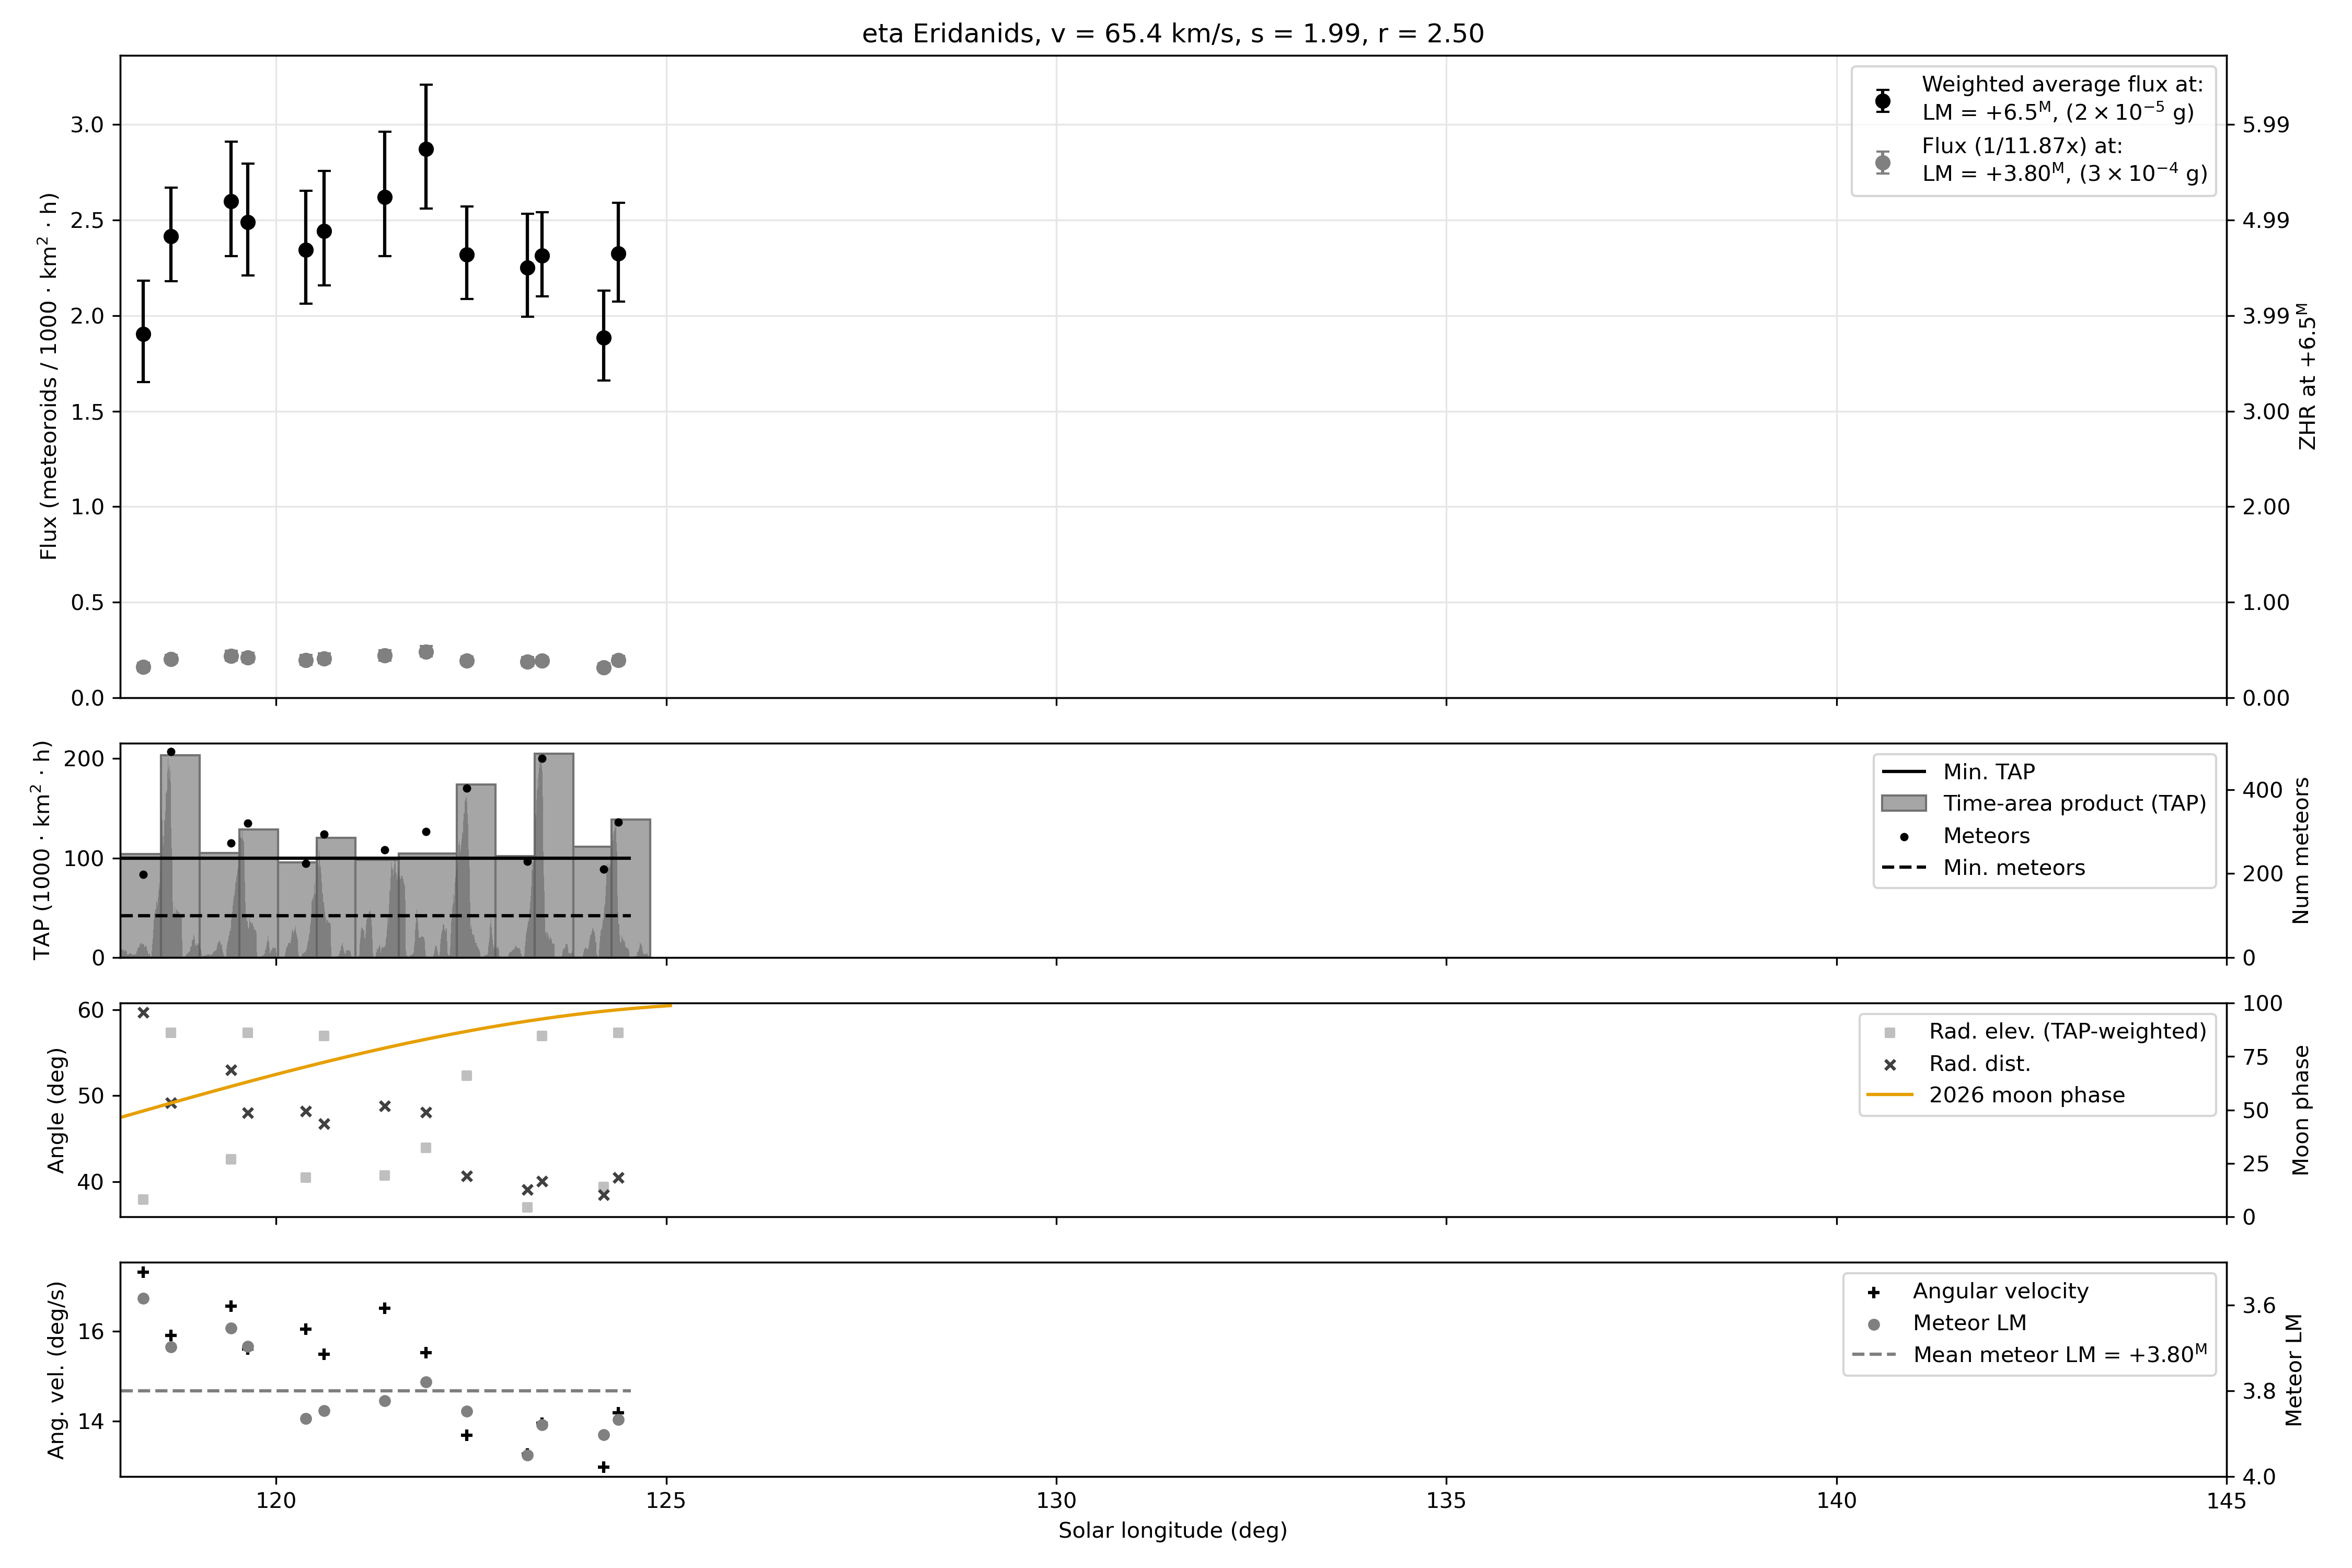
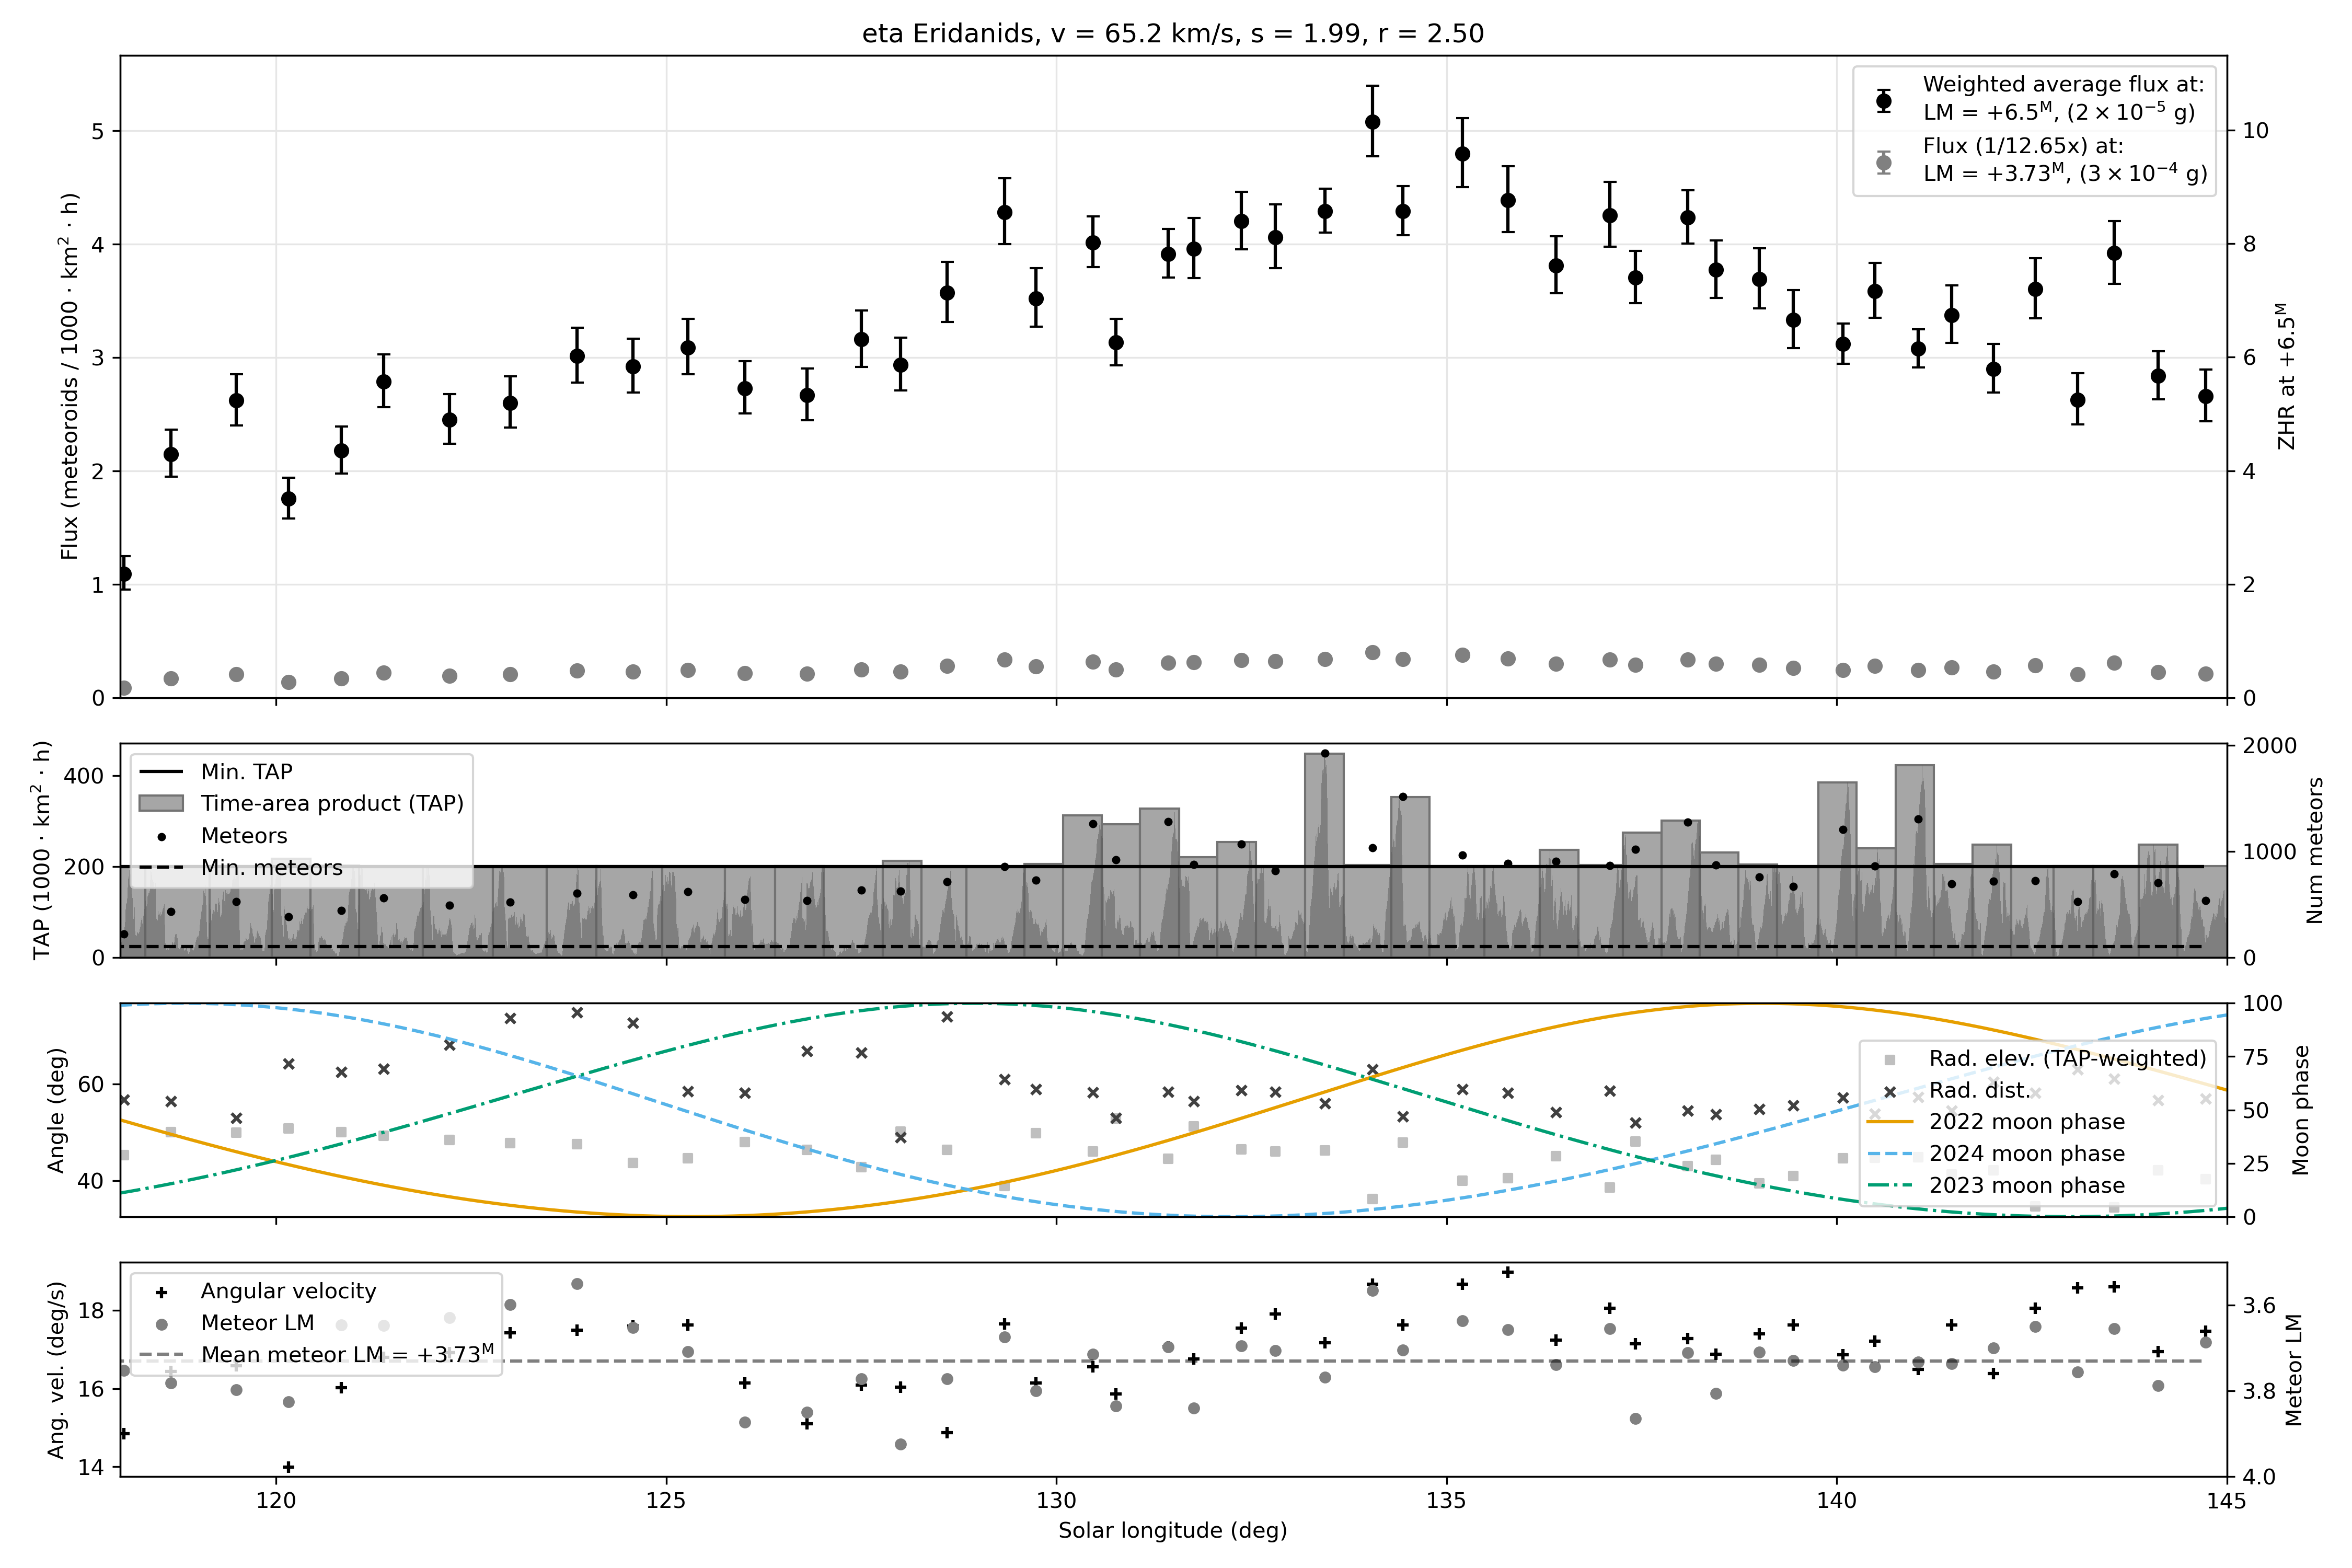
#191 ERI - eta Eridanids
Year 2026
Years 2024 - 2026
Operational shower table
| IAU # | IAU code | Name | Sol begin | Sol max | Sol end | Year | Population index |
|---|---|---|---|---|---|---|---|
| 1 | CAP | alpha Capricornids | 110.00 | 127.10 | 135.00 | annual | 2.50 |
| 2 | STA | Southern Taurids | 190.00 | 216.00 | 230.00 | annual | 2.30 |
| 4 | GEM | Geminids | 256.00 | 262.00 | 266.00 | annual | 1.90 |
| 5 | SDA | Southern delta Aquariids | 114.00 | 125.50 | 145.00 | annual | 2.30 |
| 6 | LYR | April Lyrids | 30.00 | 32.40 | 34.00 | annual | 2.10 |
| 7 | PER | Perseids | 123.00 | 140.40 | 147.00 | annual | 2.00 |
| 8 | ORI | Orionids | 198.00 | 209.00 | 225.00 | annual | 2.20 |
| 9 | DRA | October Draconids | 192.00 | 195.50 | 197.00 | annual | 2.50 |
| 10 | QUA | Quadrantids | 281.00 | 283.00 | 285.00 | annual | 2.10 |
| 12 | KCG | kappa Cygnids | 130.00 | 145.00 | 152.20 | annual | 2.10 |
| 13 | LEO | Leonids | 224.00 | 235.00 | 245.00 | annual | 2.90 |
| 15 | URS | Ursids | 269.00 | 270.40 | 272.00 | annual | 1.70 |
| 16 | HYD | sigma Hydrids | 238.00 | 256.00 | 270.00 | annual | 3.00 |
| 17 | NTA | Northern Taurids | 217.00 | 224.50 | 241.00 | annual | 2.30 |
| 19 | MON | December Monocerotids | 250.00 | 261.00 | 266.00 | annual | 3.00 |
| 22 | LMI | Leonis Minorids | 199.00 | 208.70 | 221.00 | annual | 2.00 |
| 31 | ETA | eta Aquariids | 30.00 | 46.00 | 66.00 | annual | 2.10 |
| 69 | SSG | Southern mu Sagittariids | 71.00 | 86.00 | 96.00 | annual | 2.90 |
| 171 | ARI | Daytime Arietids | 62.00 | 78.50 | 99.00 | annual | 1.90 |
| 183 | PAU | Piscis Austrinids | 124.00 | 136.00 | 142.00 | annual | 3.20 |
| 206 | AUR | Aurigids | 154.20 | 158.60 | 167.70 | annual | 2.60 |
| 208 | SPE | September epsilon Perseids | 161.90 | 166.80 | 178.40 | annual | 2.00 |
| 221 | DSX | Daytime Sextantids | 174.00 | 188.40 | 197.00 | annual | 2.20 |
| 18 | AND | Andromedids | 215.00 | 239.00 | 252.00 | annual | 2.50 |
| 184 | GDR | July gamma Draconids | 122.00 | 125.50 | 128.00 | annual | 2.50 |
| 191 | ERI | eta Eridanids | 118.00 | 137.00 | 145.00 | annual | 2.50 |
| 281 | OCT | October Camelopardalids | 191.00 | 192.50 | 194.00 | annual | 2.50 |
| 427 | FED | February eta-Draconids | 312.00 | 315.00 | 317.00 | annual | 2.50 |
| 915 | DNO | delta Normids | 329.00 | 334.50 | 338.00 | annual | 2.50 |
| 18 | oAND2021 | Andromedids | 233.00 | 245.90 | 250.00 | 2021 | 2.50 |
| 451 | oCAM2022 | Camelopardalids | 60.00 | 63.50 | 65.00 | 2022 | 2.90 |
| 61 | oTAH2022 | tau Herculids | 66.70 | 69.40 | 71.00 | 2022 | 2.51 |
| 170 | oJBO2022 | June Bootids | 88.00 | 92.40 | 99.00 | 2022 | 2.50 |
| 199 | oADC2022 | August delta Capricornids | 143.00 | 143.70 | 144.50 | 2022 | 2.50 |
| 18 | oAND2023 | Andromedids | 245.00 | 250.00 | 255.00 | 2023 | 2.50 |
| 9999 | oWir2023 | Wirtanenids | 259.50 | 259.80 | 260.50 | 2023 | 3.00 |
| 9998 | oM2024H1 | M2024H1 | 37.50 | 37.80 | 38.00 | 2024 | 2.50 |
| 446 | oDPC2024 | December phi-Cassiopeiids | 245.50 | 250.00 | 253.00 | 2024 | 2.50 |
| 9997 | oM2025L1 | M2025L1 | 68.40 | 69.50 | 73.00 | 2025 | 2.50 |
| 9996 | oM2025L2 | M2025L2 | 68.80 | 71.50 | 73.00 | 2025 | 2.50 |
| 1044 | oEPU2025 | epsilon-Ursae Minorids | 179.40 | 181.00 | 183.00 | 2025 | 2.50 |
| 9995 | oM2026E1 | M2026E1 | 328.00 | 330.00 | 334.00 | 2026 | 2.50 |
About
The plots above show near-real time flux estimates computed as part of a collaboration between the NASA Meteoroid Environment Office and the Western University Meteor Physics group for major meteor showers. These data are gathered by video cameras of the Global Meteor Network - the hardware, software and flux methodology background are provided in the references below.
The plots show the measured physical meteor flux (left hand axis) while the equivalent Zenithal Hourly Rate (number of meteors an observer would see under ideal skies with the radiant overhead in an hour) is shown on the right axis as a function of solar longitude (J2000). The assumed population index (which is used to convert flux to ZHR) is assumed constant over the duration of the shower is shown in the header. The equivalent flux to a limiting meteor absolute magnitude of +6.5 and the average limiting meteor magnitude for the measurements are shown, where the equivalent meteoroid mass uses the Mass-Magnitude-Velocity relationship of Verniani (1973). Uncertainties reflect Poisson statistics only (95% confidence interval).
When a plot on the front page is clicked, a full plot including additional metadata will open. The second inset in the full plot shows the number of single station meteors associated to the shower by all cameras in varying time bins (black dots). The per bin equivalent time-area-product (TAP) of coverage in the atmosphere (in units of 1000 km2 hr) is also shown. The time bin sizes are computed by requiring each bin to contain a minimum number of meteors (min meteors) and a minimum TAP.
The third inset in the full plot show the average radiant distance from the cameras center field of view, the apparent elevation of the radiant (weighted by the TAP) and the moon phase (0 = new and 100 = full).
Finally, the fourth inset shows the average meteor angular velocity (in degrees per second) measured in the cameras field center (black crosses) and the theoretical limiting detectable meteor magnitude taking all corrections into account also at the field center.
Data are updated once per day on a global basis.
References- Verniani, F., 1973. An analysis of the physical parameters of 5759 faint radio meteors. Journal of Geophysical Research, 78(35), pp.8429-8462.
- Vida, D., Erskine, R.C.B., Brown, P.G., Kambulow, J., Campbell-Brown, M. and Mazur, M.J., 2022. Computing optical meteor flux using global meteor network data. Monthly Notices of the Royal Astronomical Society, in press. MNRAS, arxiv.
- Vida, D., Segon, D., Gural, P.S., Brown, P.G., McIntyre, M.J., Dijkema, T.J., Pavletic, L., Kukic, P., Mazur, M.J., Eschman, P., Roggemans, P., Merlak, A. and Zubovic, D., 2021. The Global Meteor Network - Methodology and first results. Monthly Notices of the Royal Astronomical Society, 506(4), pp.5046-5074. MNRAS, arxiv.
Data usage
The data are released under the CC BY 4.0 license. If you are using the data for scientific purposes, we kindly ask you to reference the following papers:
- Vida, D., Segon, D., Gural, P.S., Brown, P.G., McIntyre, M.J., Dijkema, T.J., Pavletic, L., Kukic, P., Mazur, M.J., Eschman, P. and Roggemans, P., 2021. The Global Meteor Network - Methodology and first results. Monthly Notices of the Royal Astronomical Society, 506(4), pp.5046-5074.
- Vida, D., Blaauw Erskine, R.C., Brown, P.G., Kambulow, J., Campbell-Brown, M. and Mazur, M.J., 2022. Computing optical meteor flux using global meteor network data. Monthly Notices of the Royal Astronomical Society, 515(2), pp.2322-2339.
Also, we kindly ask you to add this text in the acknowledgements of any publications:
The Global Meteor Network (GMN) data are released under the CC BY 4.0 license. The authors acknowledge that the GMN data collection was supported in part by the NASA Meteoroid Environment Office under cooperative agreement 80NSSC21M0073 with the Western Meteor Physics Group.